Table of Contents
SDR Projects
Introduction
A USB SDR (Software Defined Radio) dongle allows a device to tune into a range of frequencies defined by the user in order to explore and analyse wireless transmissions.
I have a few projects which require SDR hardware which I will talk about below.
Wireless Sensors
Using a piece of software called rtl_433, I am able to decode many types of transmissions on 433MHz. This frequency is commonly used by weather station sensors; I am using 4 of these which I briefly talk about on the sensors page. This frequency is also used to transmit tyre pressures from cars in some countries. All rtl_433 data is sent to Node-Red on my server and saved into a database, some of it is also forwarded to a service I created called IoTPlotter.
Pagers
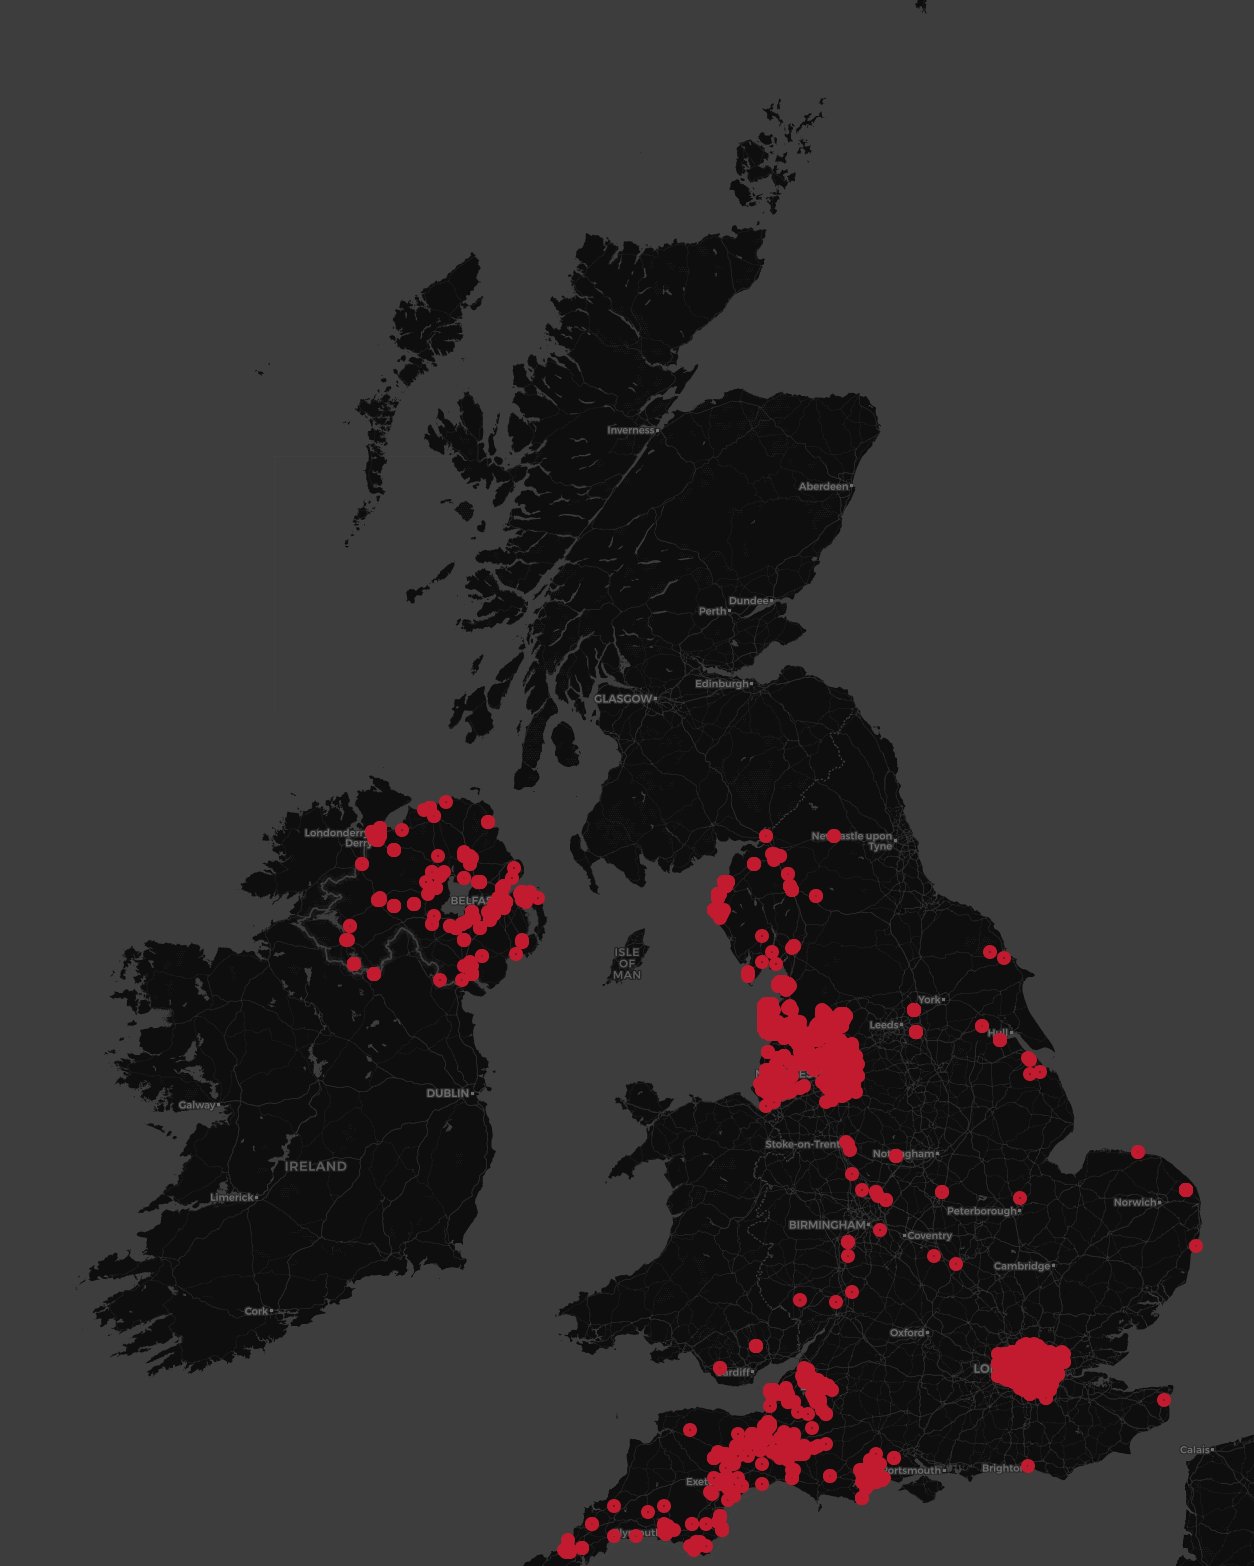
I wrote a script which would parse postcodes and coordinates from pager messages sent over unencrypted POCSAG. These messages were commonly sent by the emergency services. The message contents were immediately discarded after processing for privacy reasons and the locations were plotted on a map (see below image)
I also briefly talked about this project on Twitter. I stopped running this after a few weeks due to concerns about the legality of it.
Planes
Using an SDR dongle and a Raspberry Pi (or any other computer) it is very easy to set up a plane tracker. Lots of effort from the open source community makes this easy for almost anybody to set up. I am currently running the software created by FlightRadar24 to add ADS-B aircraft tracking coverage to my area. This means that nearby planes will appear on FlightRadar24 so that anybody can track the movement of it. Thousands of people are running receivers to add coverage all around the globe.
Lightning
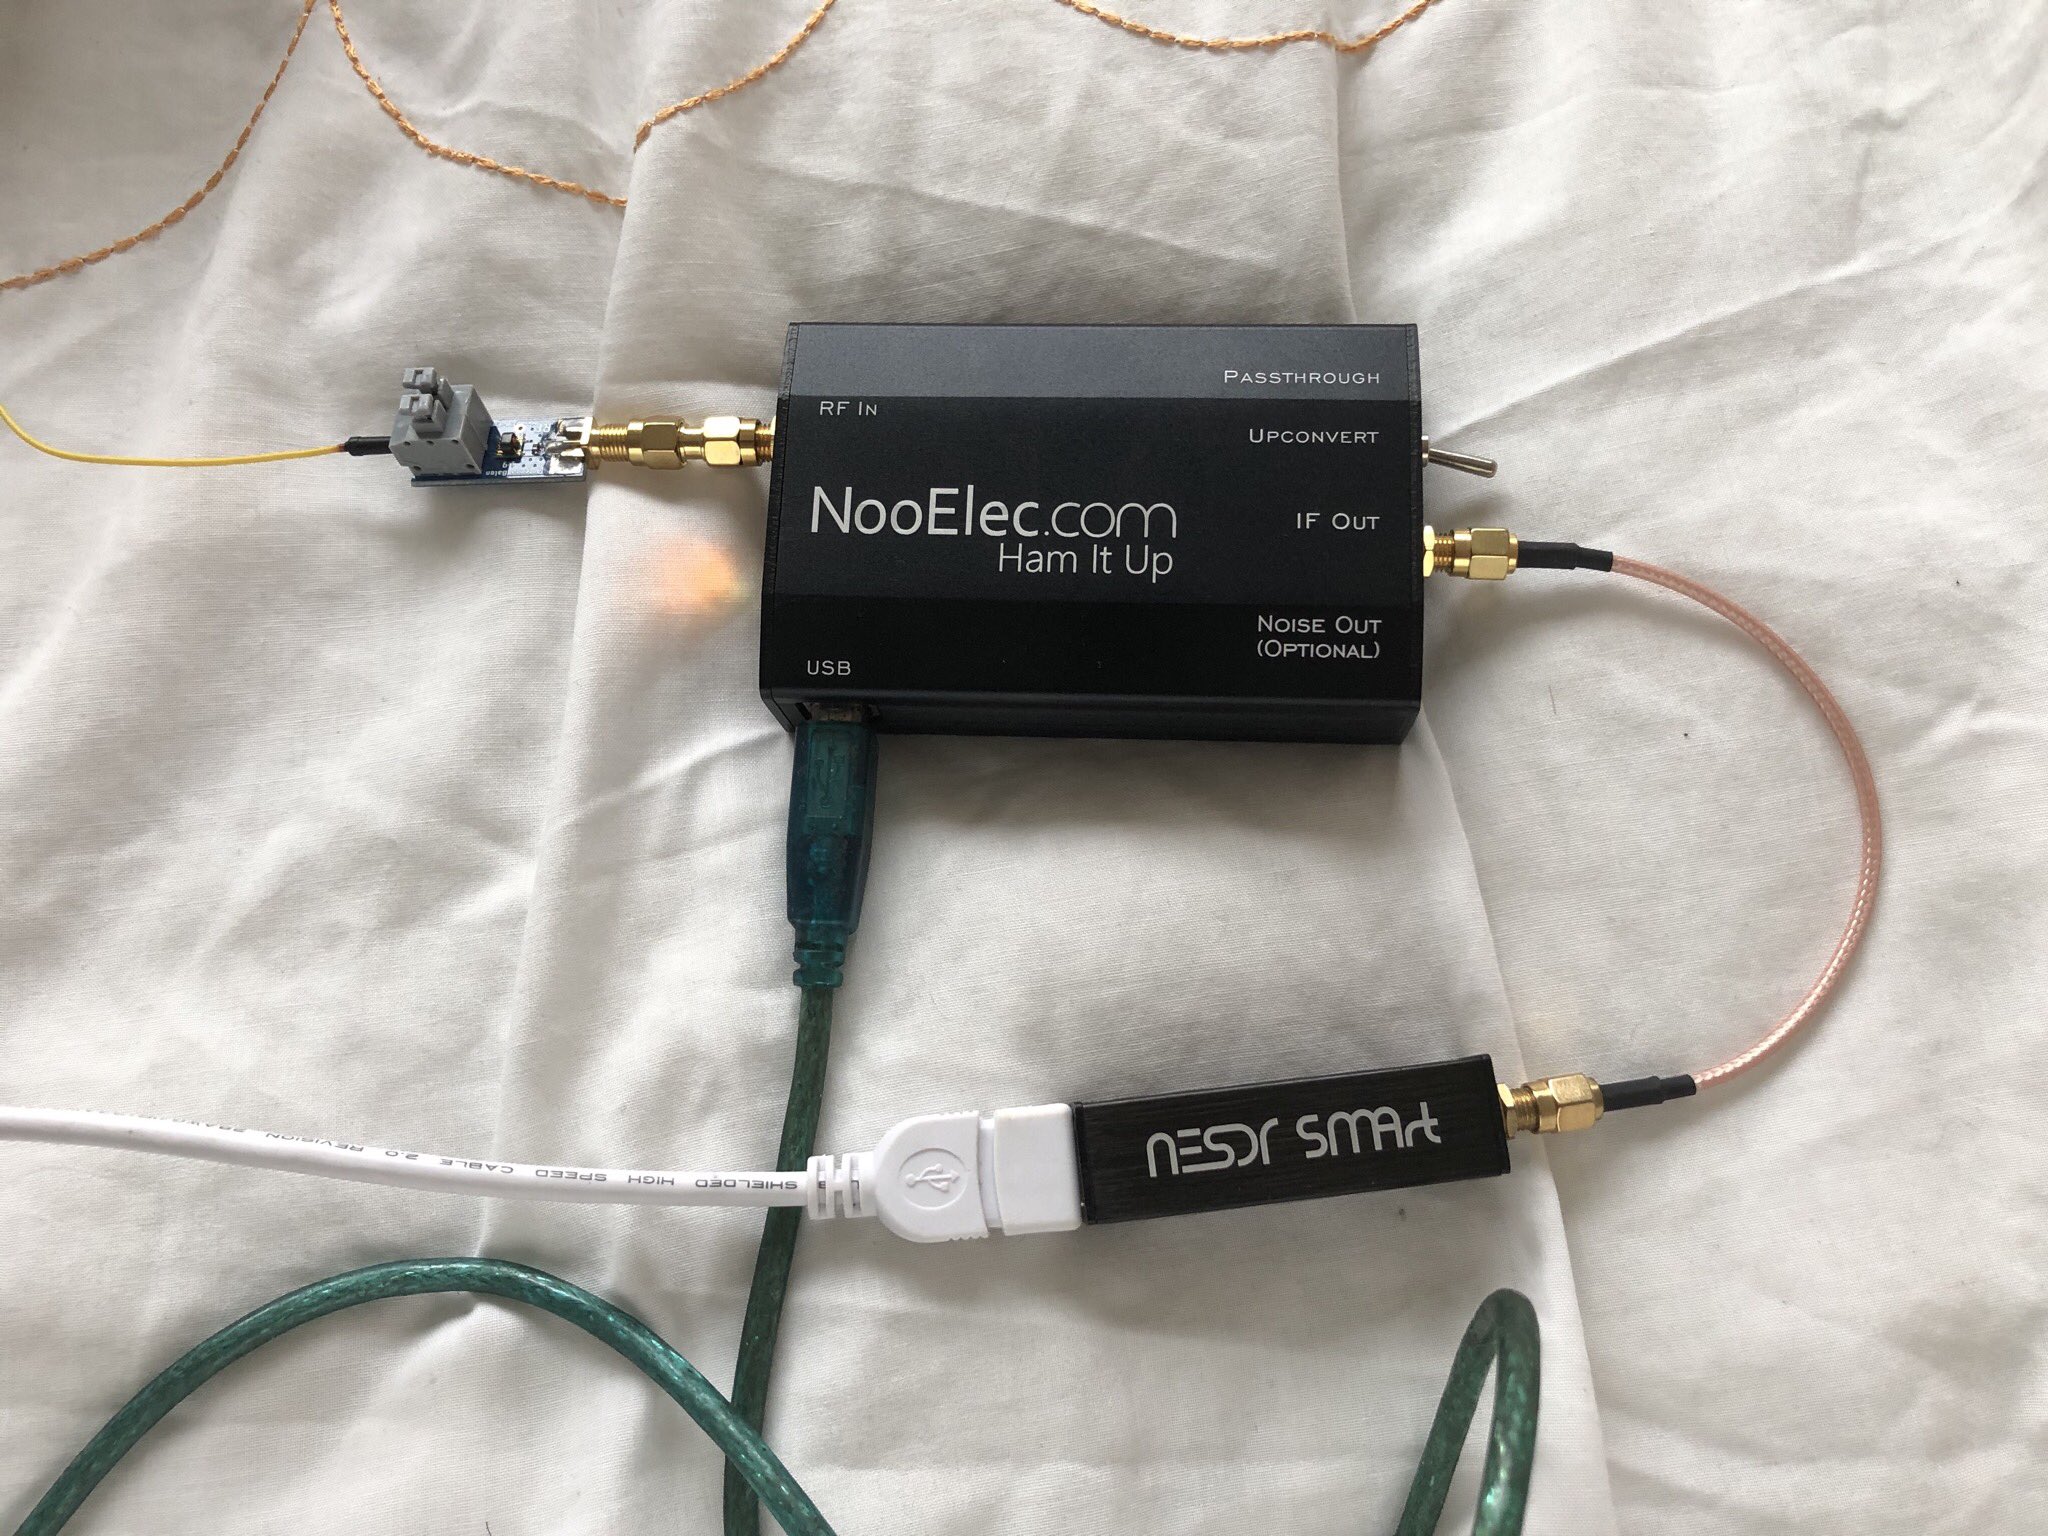
By using a NooElec “Ham it Up” alongside my SDR I am able to tune into frequencies between 0-23MHz. By visualising the range of frequencies between 0-1Mhz, it is possible to see a “signal” spanning the whole range caused by lightning strikes. Some services such as LightningMaps.org use this principal and crowd sourced data to track the location of lightning in real time.
This image shows the hardware I used.
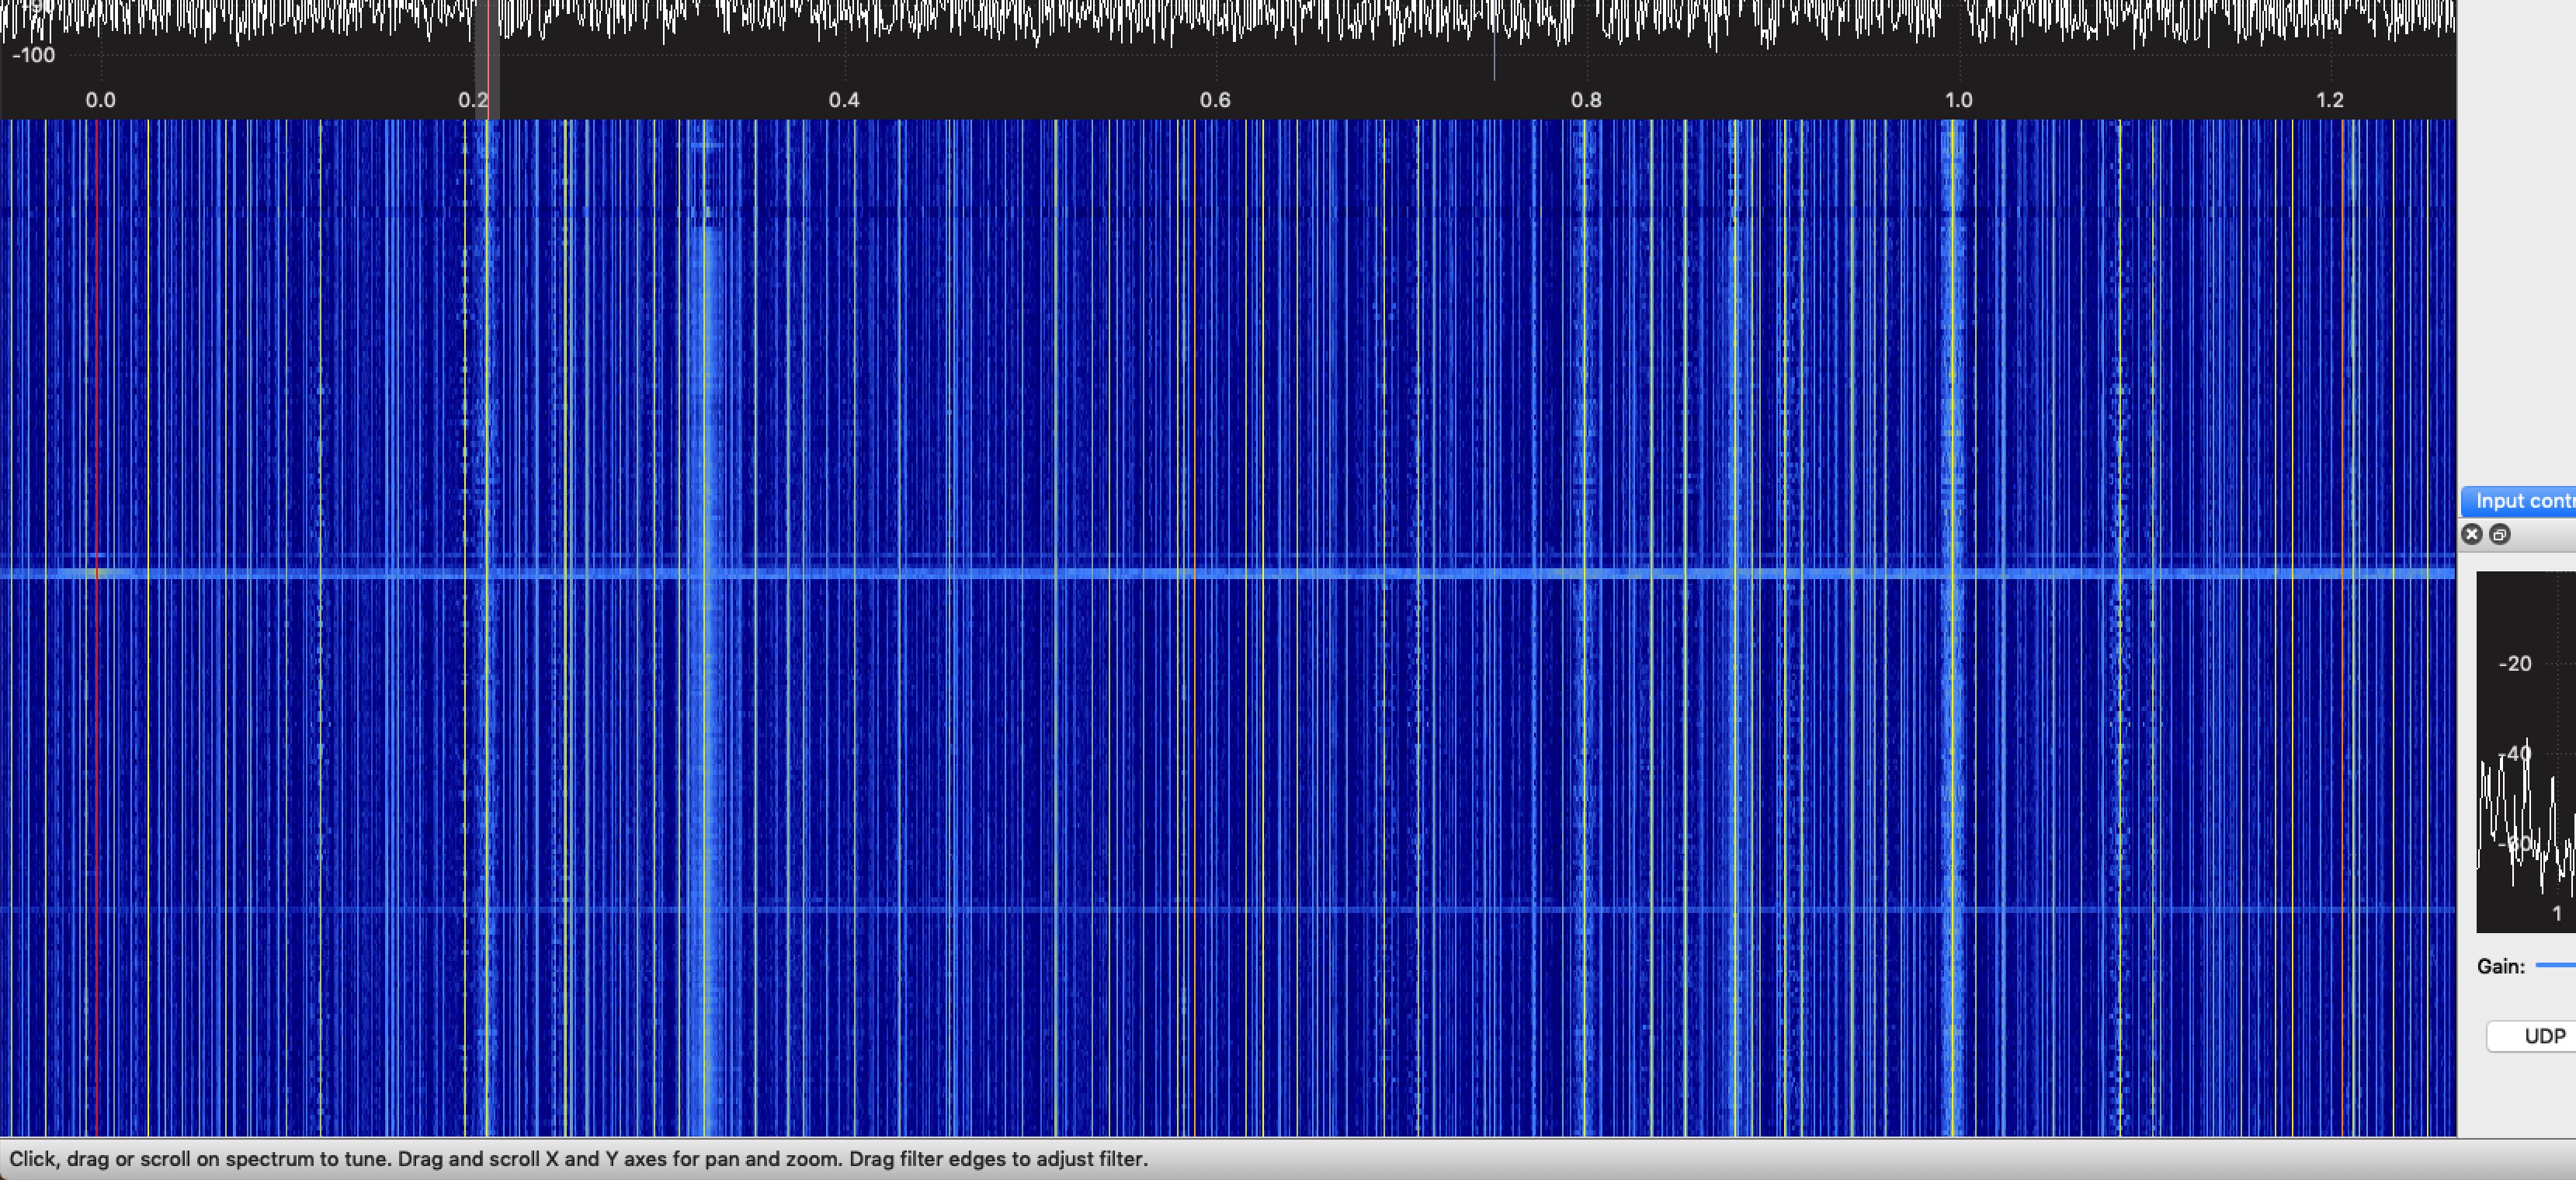
The following image shows a screenshot of the SDR signal visualisation (“waterfall”) during a lightning strike. The bar spanning the whole frequency range was caused by the strike:
There is a second bar further down which also spans the full frequency range which was also caused by lightning, but that strike was further away.
I also talked about this project on Twitter.
Numbers Stations
I don't know the exact purpose of “numbers stations” but they are commonly broadcasting from various locations around the world. These can be tuned into using an SDR (or any other regular radio which supports AM). By using the visualisation tools of an SDR, it is easier to find and tune into a station if you don't know the exact frequency.
I received a few transmissions from numbers stations back in June 2020 and posted a video showing the SDR waterfall and audio from the station on this Tweet
Tyre Pressure Monitoring (TPMS)
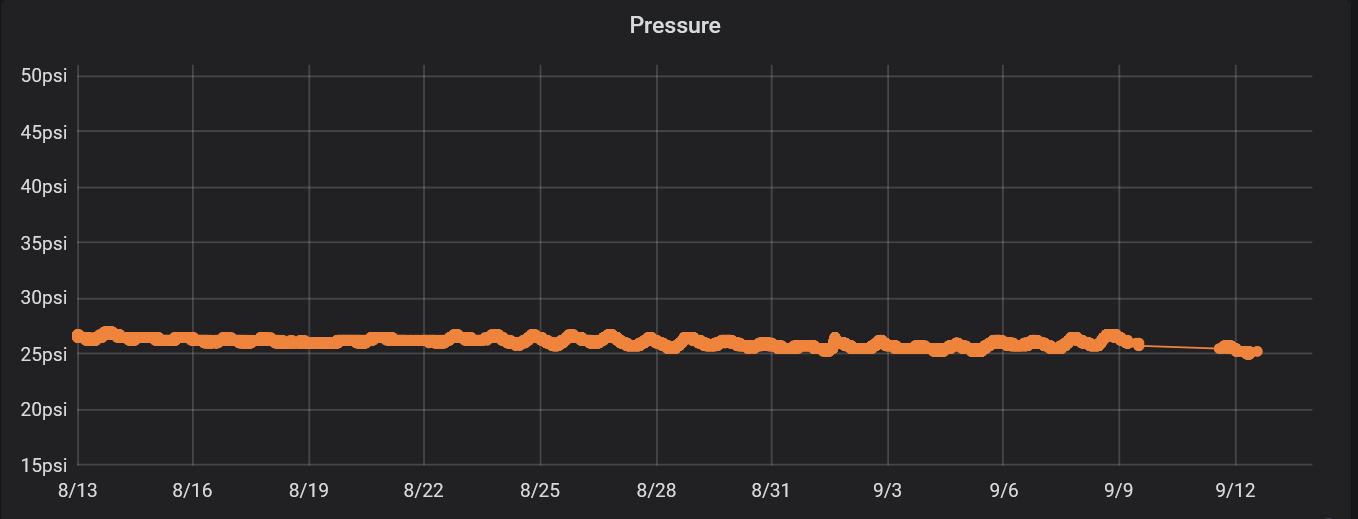
The tyre pressure monitoring system generally operates either on 433MHz or 315MHz and can be picked up with rtl_433. My server records all 433MHz data it receives and this includes tyre pressure information for nearby vehicles. I am able to graph tyre pressures for nearby tyres which have monitoring hardware installed:
Many TPMS transmissions also include a temperature which is also logged. I wrote a script which gathers all temperature readings from the last 15 minutes and averages them. The end result of this is a somewhat accurate crowd-sourced outdoor temperature graph:
This temperature graph does have lots of outliers but it's reasonably accurate if you ignore those.


