Table of Contents
Environmental Monitoring Sensors
Introduction
When I was 14 I received an Arduino and one of my first projects was a temperature logger using a DS18B20 temperature sensor. Since then, I have added many more sensors and brought sensors into more locations.
Data Logging
I have upgraded most of my hardware to ESP8266 or ESP32 boards which means data can be transmitted directly to my home server over MQTT via the WiFi. I am running Node-Red which handles all of the sensor data and sends most of it to IoTPlotter which is a service I created. Node-Red also does some basic data processing like removing anomalous data and averaging.
I still have a DS18B20 temperature sensor connected to an Arduino which transmits data on 433MHz to another Arduino (with an ethernet shield). This is left over from my initial project 10 years ago and is still running the original code. The purpose of this was to cut down on the number of ethernet/wifi shields required because 433MHz is very cheap to implement but networking on Arduino boards was not cheap back then. I now consider the low cost ESP8266/32 boards to be much cheaper and better in general.
I have some “off the shelf” WS-07 weather station transmitters for monitoring the temperatures inside of our fridges and freezers. The data from these transmitters is collected with some software called rtl_433 and a USB Nooelec NESDR SMArt v4 SDR
List of Sensors in use
- DS18B20: Temperature
- MH-Z19B: CO2 (Carbon Dioxide)
- MQ2, MQ3, MQ4, etc: multiple gasses each
- SBM-20 GM Tube: Radiation counts per minute
- SDS011: PM2.5/PM10 (air particles such as dust/smoke)
- CCS811: VOCs (Volatile Organic Compounds)
- WS-07 433MHz transmitters: Temperature and Humidity
- CurrentCost 433MHz transmitter: Power consumption
- Thermocouple Type-K: Extreme temperature
- LDR: Light Level
- BMP180: Pressure and Temperature
- BME280: Pressure, Temperature, and Humidity
- Portable Wardriver*: WiFi, GSM, Bluetooth
*The portable wardriver technically isn't a sensor, but I placed one in a permanent spot to monitor the amount of WiFi networks, Bluetooth devices, and GSM tower signal strengths.
Radiation Monitoring
I am using an SBM-20 geiger tube connected to an ESP8266 board in order to count the number of “clicks” from the tube. The ESP8266 then uploads that data via WiFi and MQTT to my server where it is then forwarded to gmcmap.com and radmon.org. By submitting the data to those sites, I am contributing to crowd sourced radiation data.
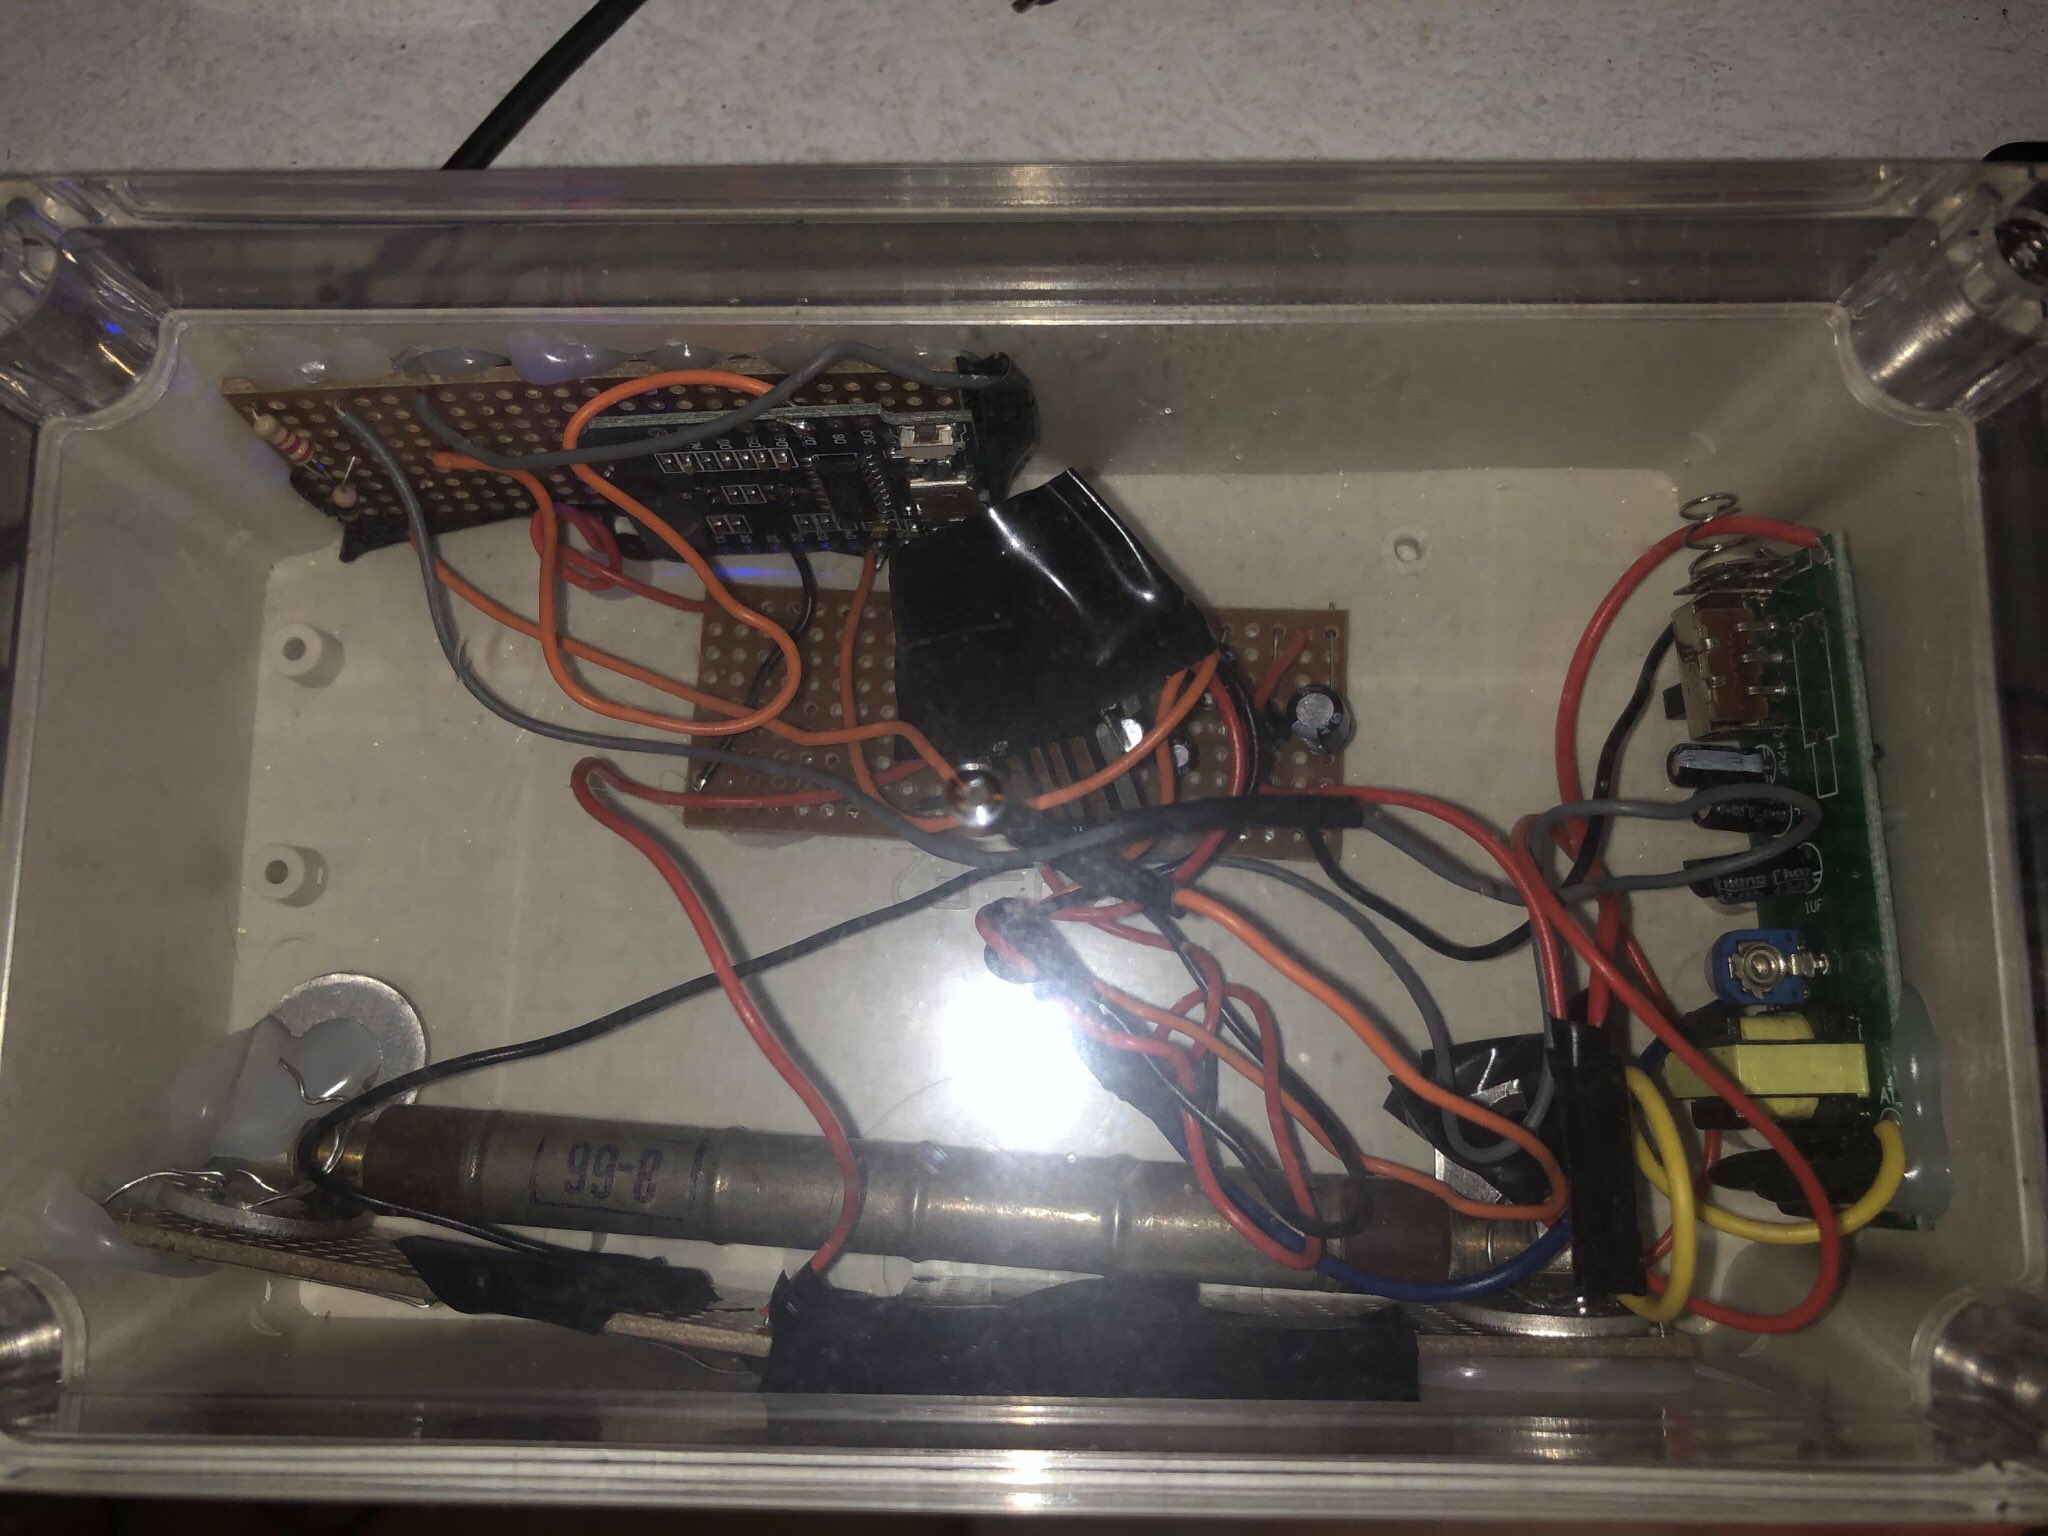
The hardware isn't neat at all, but it works very well. I do intend to tidy this up at some point but I'm going to leave it alone while it is working. Some people do appreciate the data coming from this sensor, so I don't want to take it offline just for the purpose of making it look nicer.
On the right of the enclosure, you can see the 12v to 400v step up board. The high voltage output is then fed into the SBM-20 and the output is fed into the ESP8266 through a voltage divider.
PM2.5/PM10 and VOCs
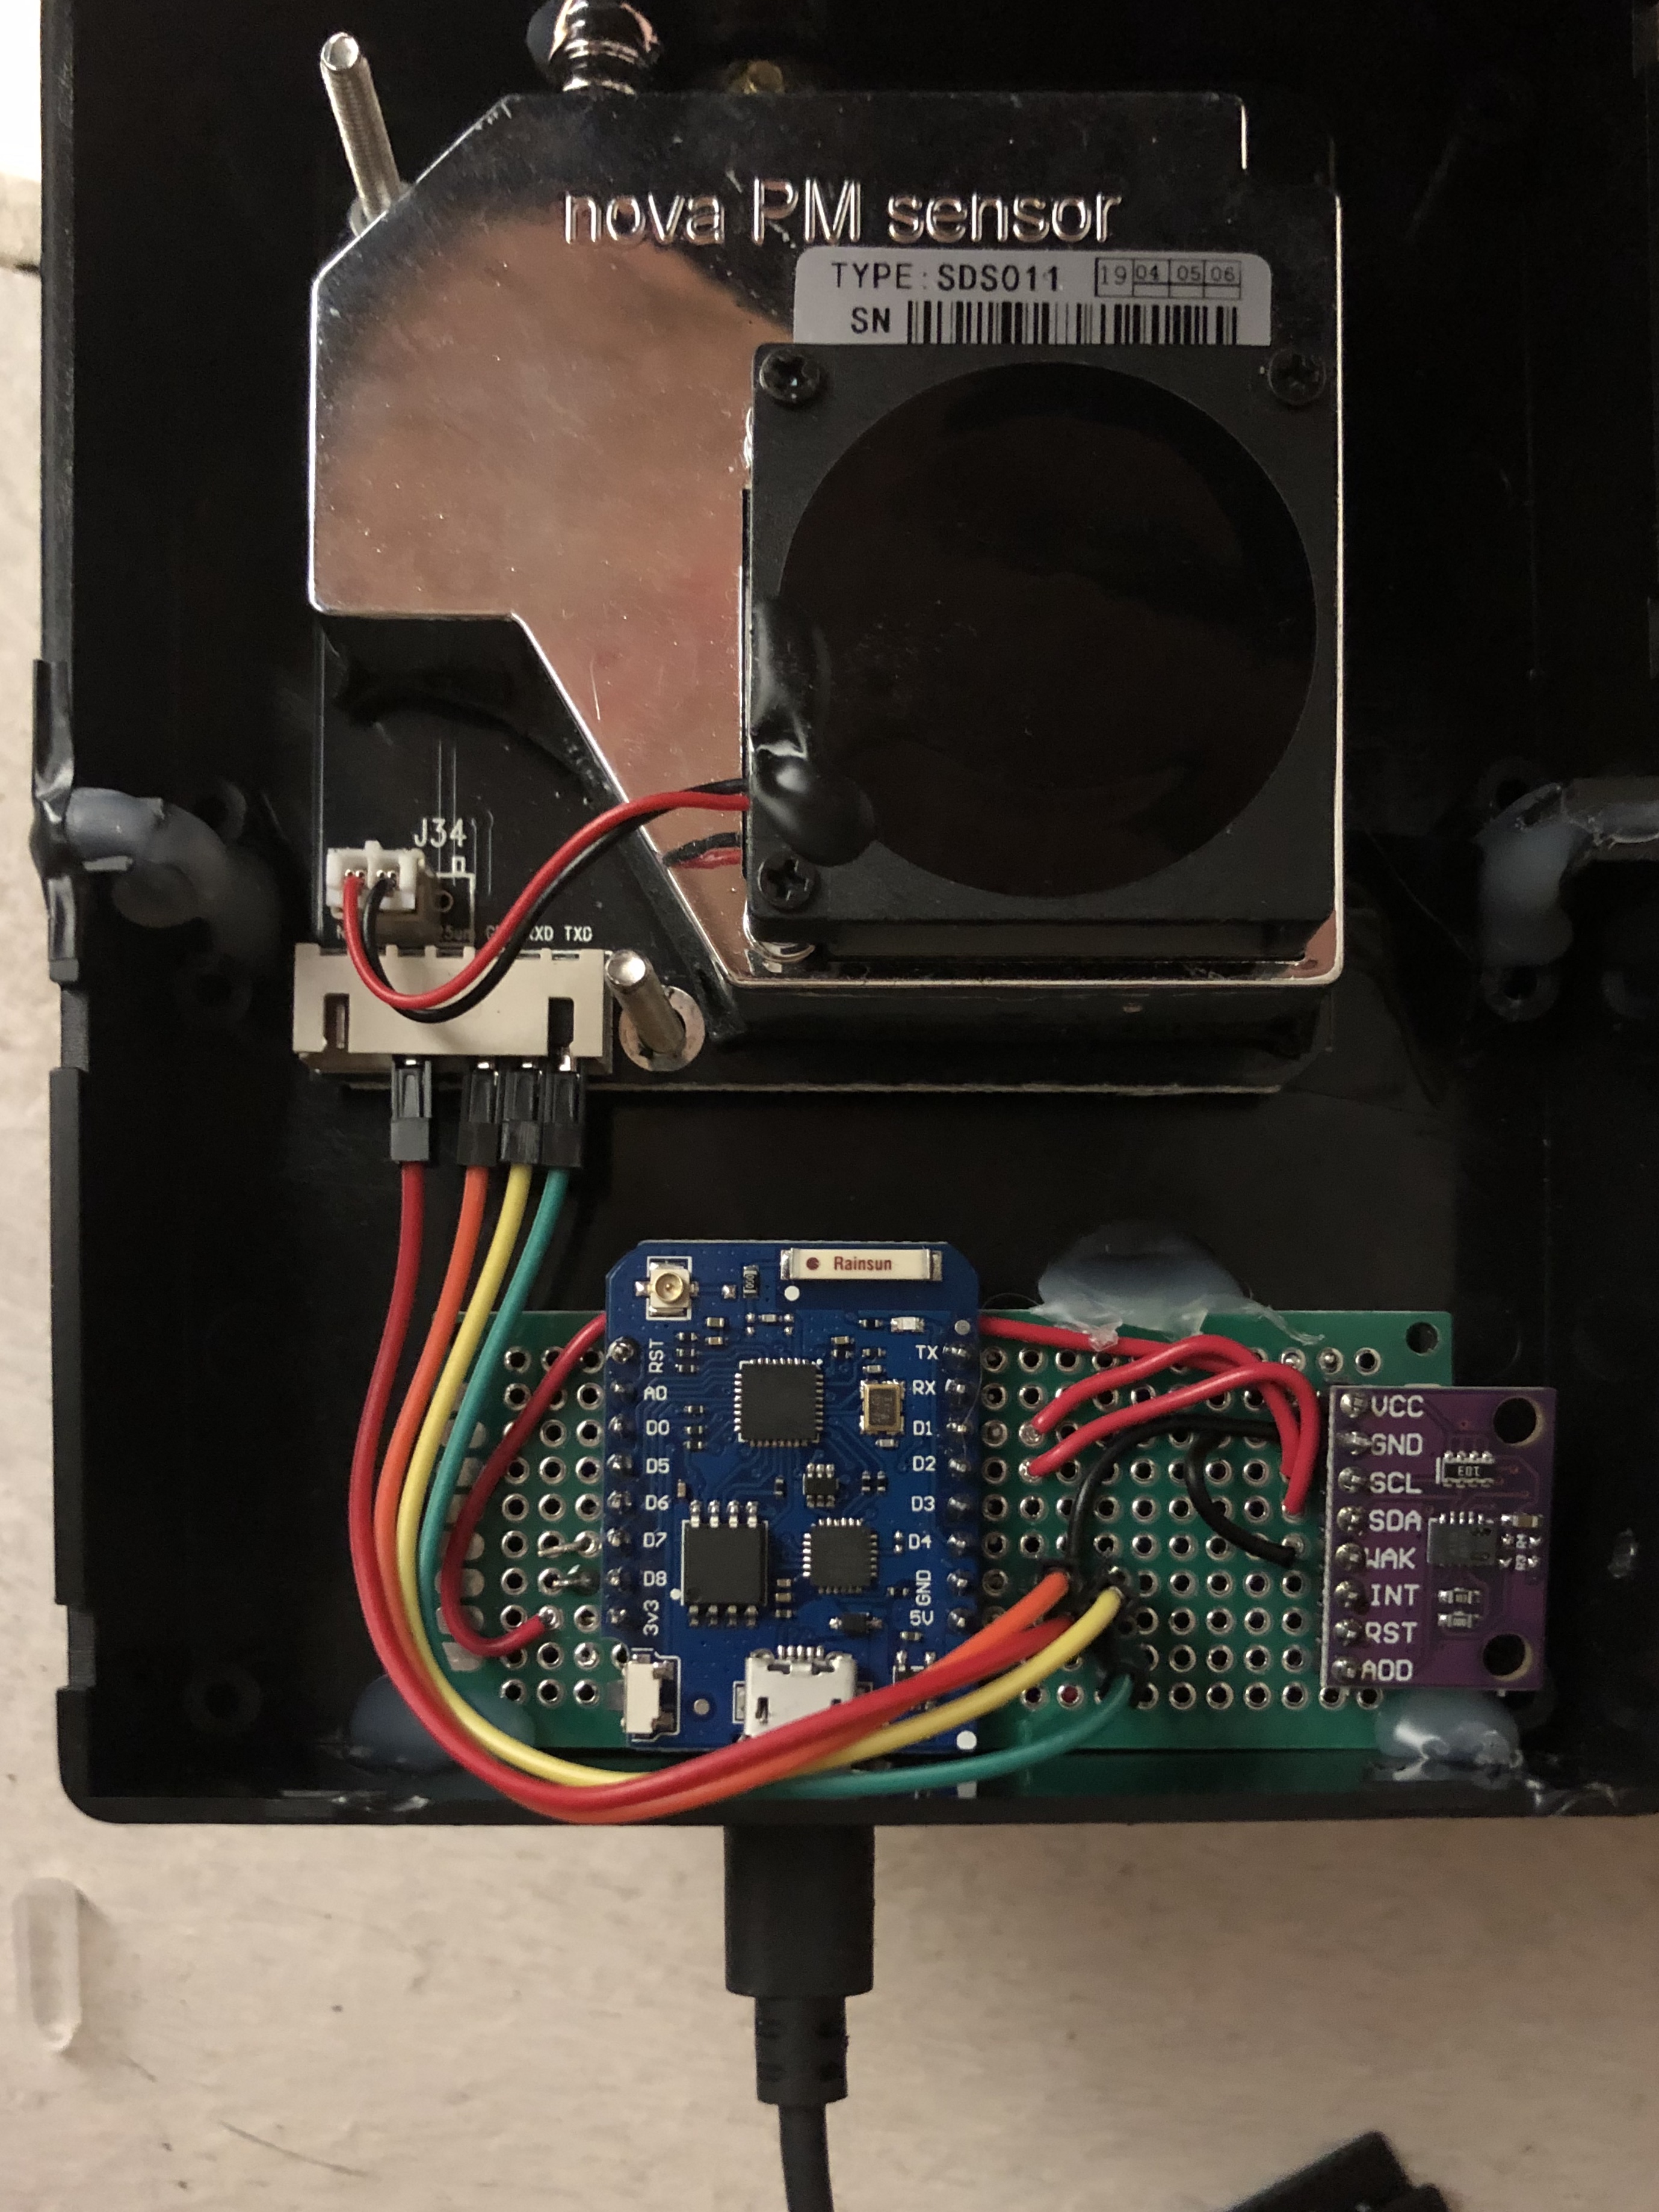
By connecting an SDS11 PM2.5/10 sensor to an ESP8266 along with a CCS811 VOC sensor, I am able to get a good indication of the air quality in the room.
The PM2.5/10 data gives an indication to the number of particles suspended in the air. These particles are generally considered to be harmful to human health in large amounts (or smaller amounts for long durations). In my experience, the number of particles will increase when cooking, cleaning, soldering, or working with products which produce smoke. Lower is always better.
The VOC sensor is sensitive to many types of gasses and often spikes up throughout the day. It is sensitive to some toxic products like varnish and adhesives, but it is also sensitive to normal human gasses meaning it generally increases if there is a person in the room with it.
I will experiment with this sensor in the future. I think that by combining a CO2 sensor with the CCS811 VOC sensor, it may be possible to exclude human gasses from the VOC data. This is because the CO2 increases when humans are nearby in a similar way to the VOC data.
Generally, the VOC data is a good indication of how much airflow a room has. Assuming there is no offgassing from chemicals, the VOC count will only increase when people are nearby; the increase will be slower if the room is well ventilated. If the VOC reading is high, people will probably consider the room to be uncomfortable in some way so it does serve as a reasonable general air quality sensor.
Carbon Dioxide
Just for clarification; this is carbon dioxide (CO2) and not carbon monoxide (CO) – it's the stuff you breathe out and not the “silent killer”.
I started adding CO2 sensors to common rooms of the house in May 2020 because I had read that medium CO2 levels can cause focus issues and tiredness which I was experiencing at times. The data from this sensor did show the CO2 levels in some rooms were higher than recommended and could possibly cause concentration issues; by opening doors/windows, this can be avoided.
I soon discovered that CO2 sensors could be used to determine how populated a room was or how often people were entering/leaving the room (see Tweet). Other people also discovered this fact and now CO2 sensors are being used to detect public areas with bad ventilation. Now, more than ever, good ventilation is important anywhere which contains multiple people.
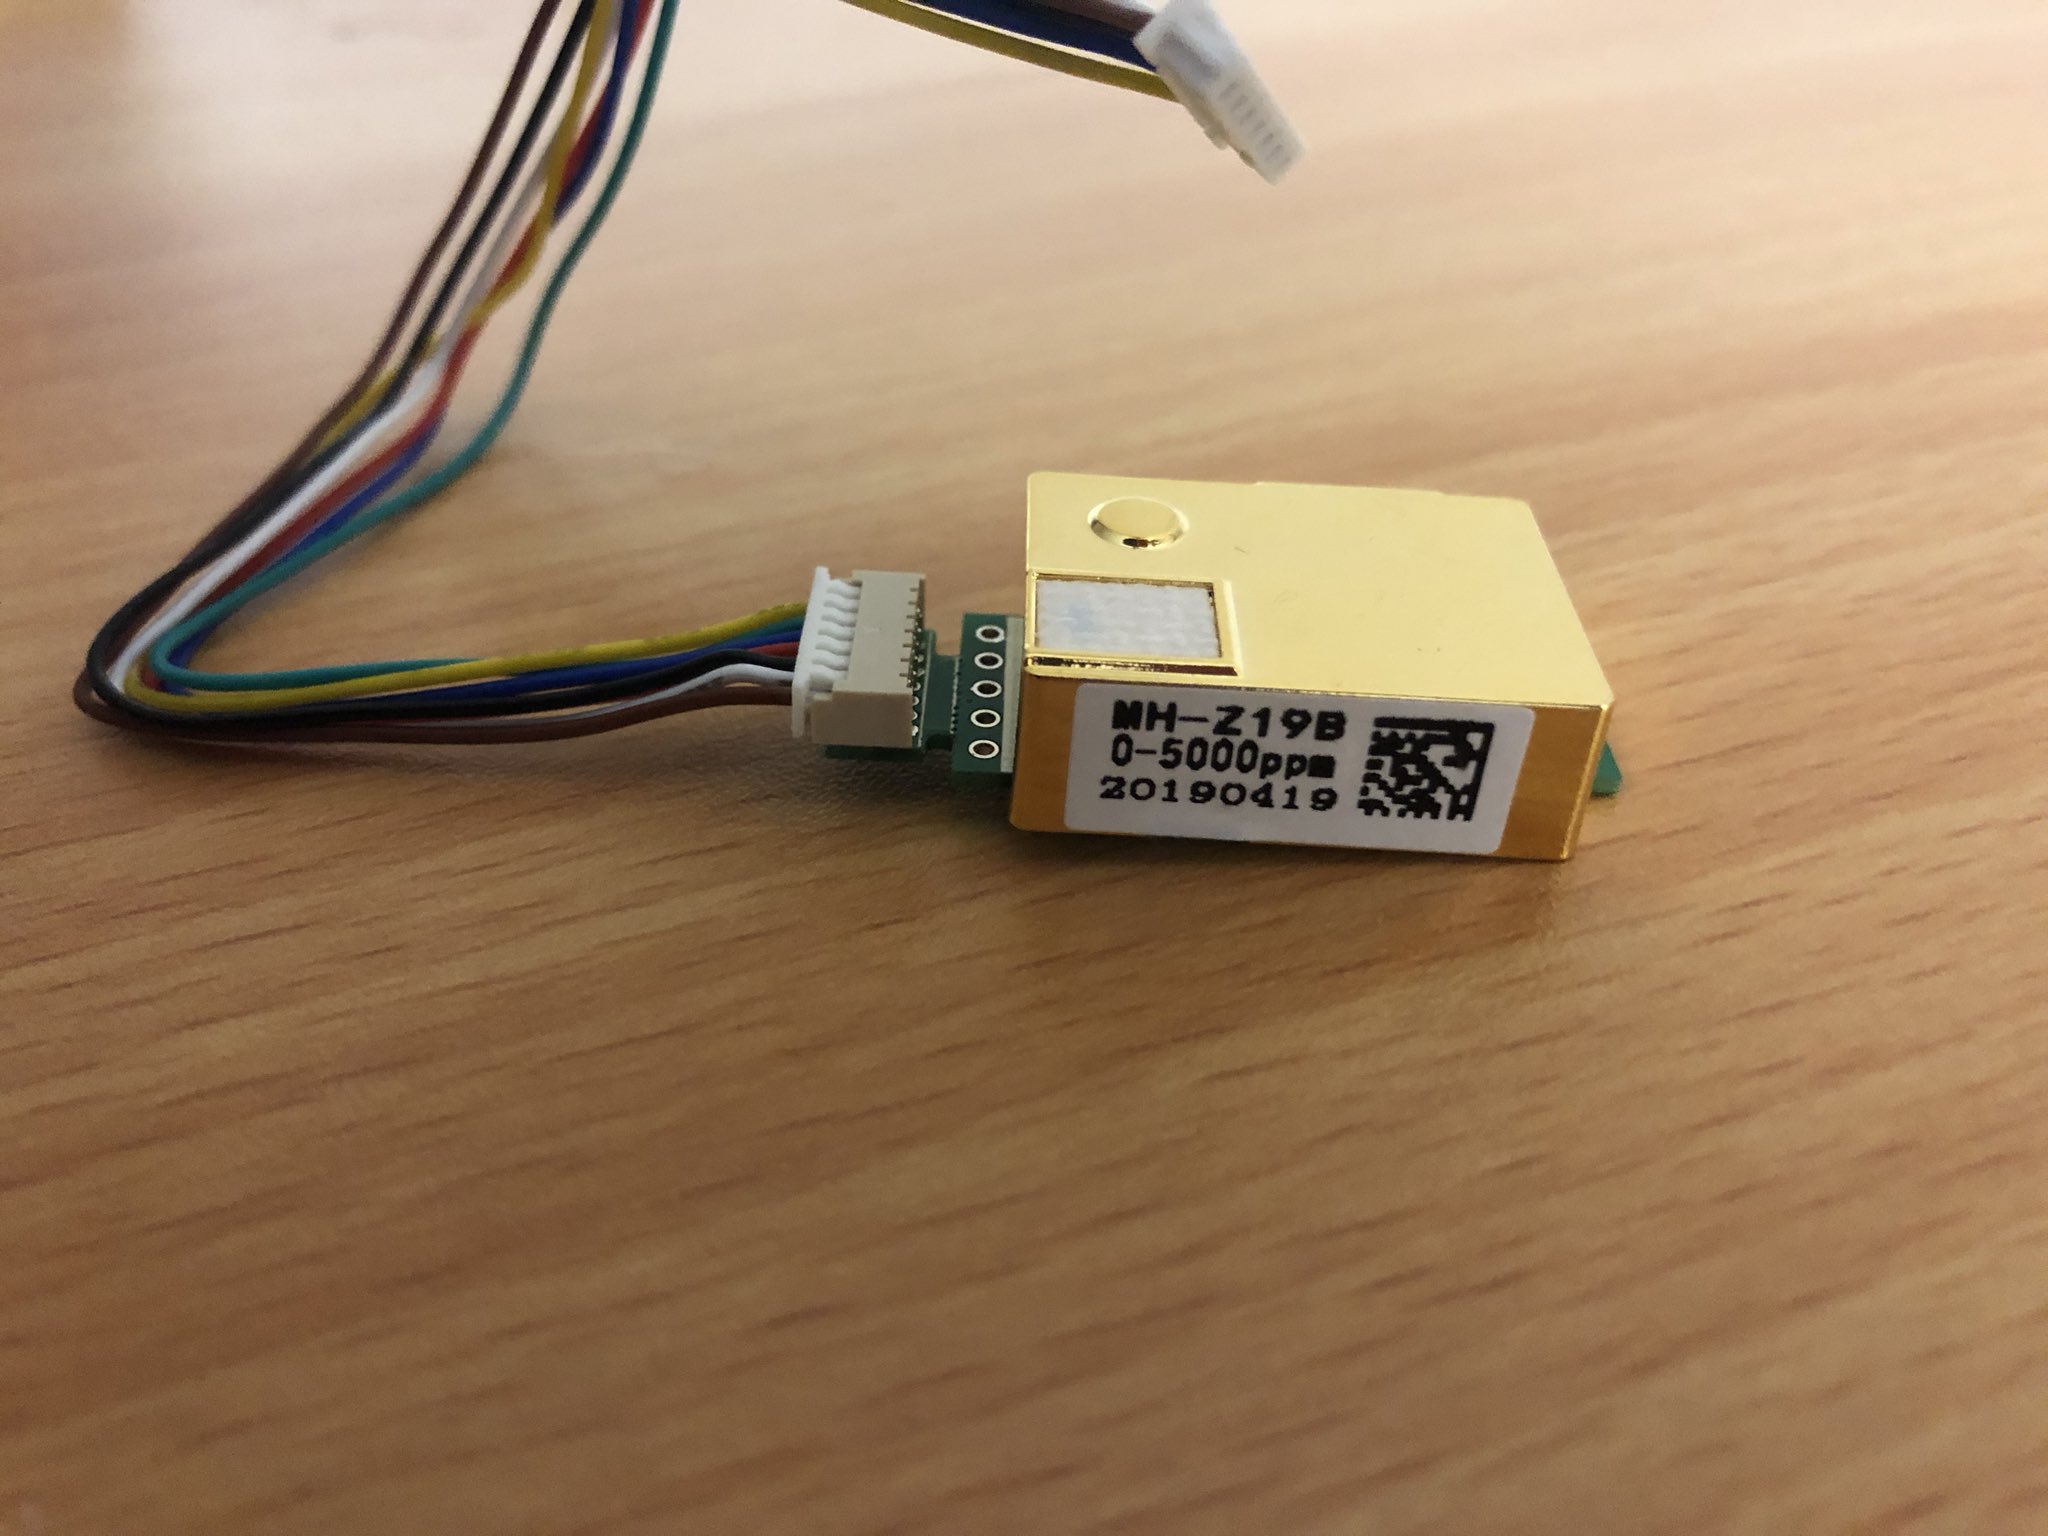
I don't have an image of the fully assembled unit (only the sensor itself, as shown above) but once again I am using an ESP8266 board to transmit the data to my server.
MQ Gas Sensors
I wired up multiple MQ gas sensors a few years ago but failed to create any documentation at the time. I now have 7 sensors reporting data to my server without knowing what that data actually corresponds to.
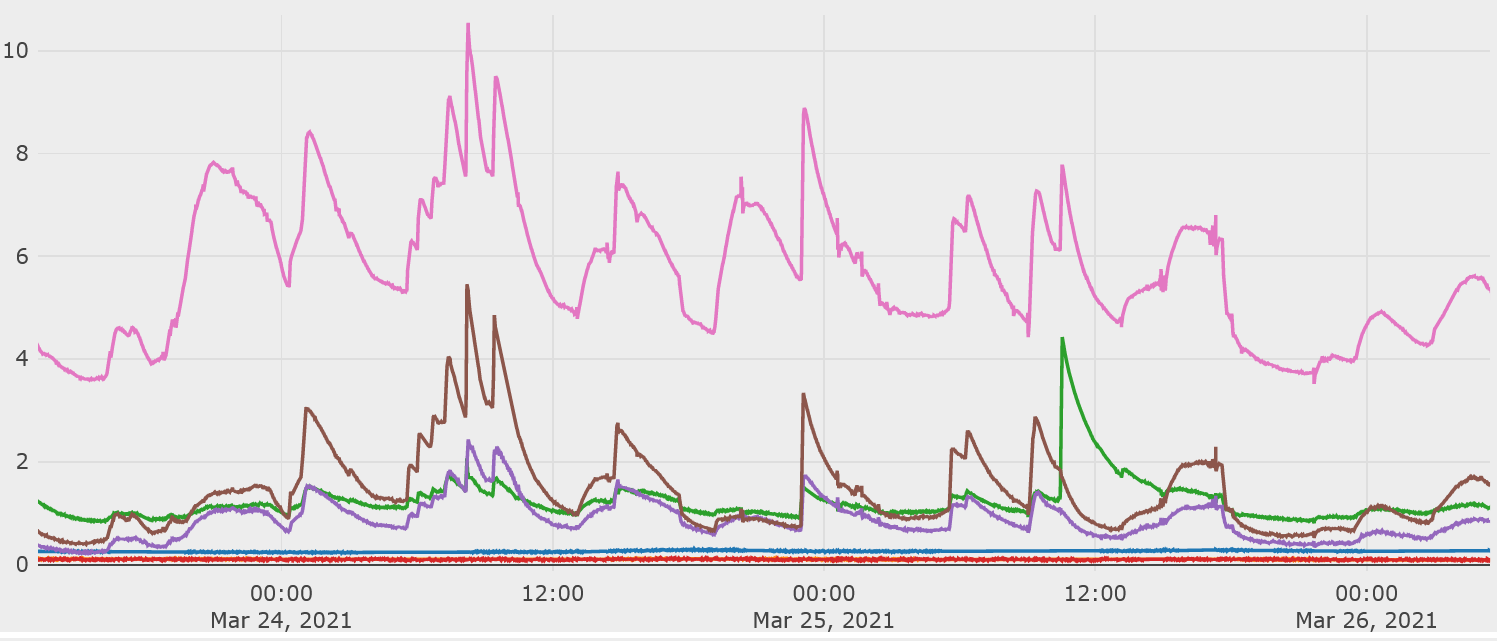
Each of the 7 sensors is sensitive to a different range of gasses so it should be theoretically possible to identify gasses based on the data from all 7 sensors. Below is a screenshot showing about 48 hours of data collected by the sensors plotted onto a single axis
In general, this is not easy to interpret. The values corrospond to voltage from the sensors (they're analog sensors) but mapped to a larger range so it's more human-readable. This data can only be used for spotting trends or unusual readings from the sensors; it cannot be used to determine gas concentrations.
The pink and brown lines are sensors which are sensitive to human gasses so they regularly increase when somebody is in the room. The green line is sensitive to flammable gasses and rises when aerosols are sprayed in the room due to the butane.
The two flat lines on the graph are sensitive to CO (carbon monoxide) and alcohol vapors so they don't increase very often.
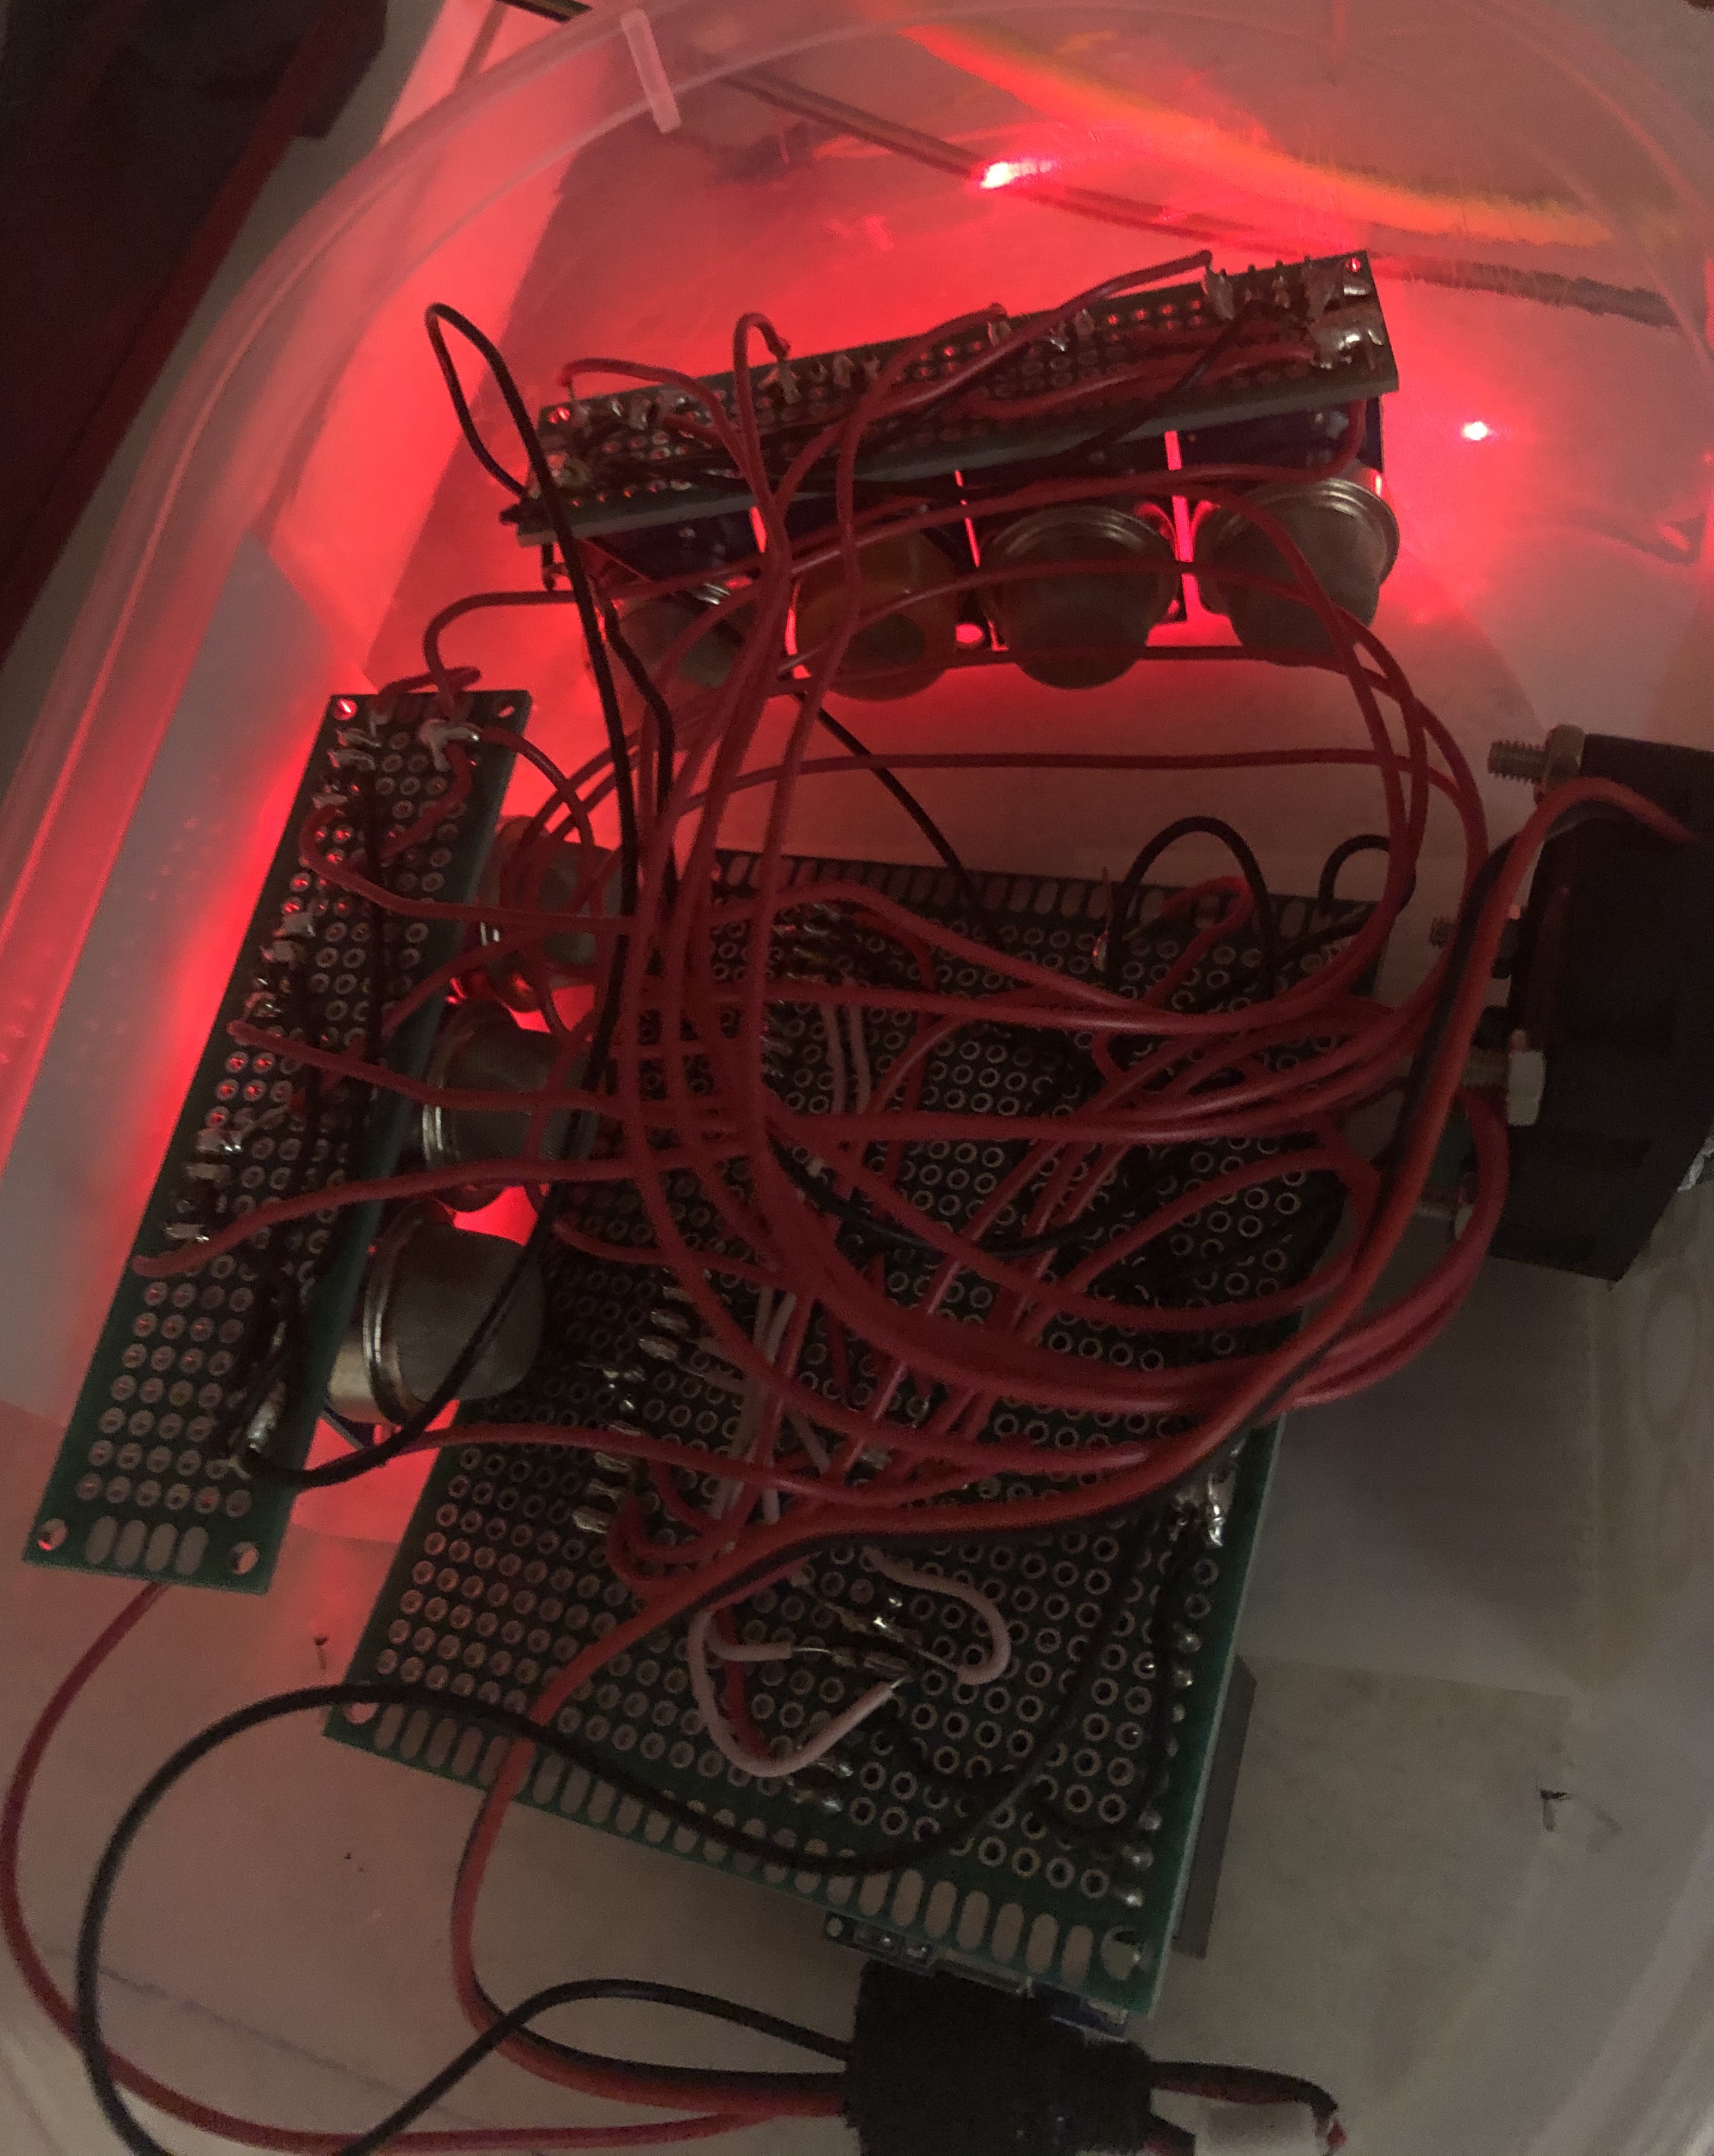
Here is an image of the absolute mess of wiring and sensors:
Once again, I am using an ESP8266 board to send the data to my server. I am also using i2c analog to digital converters which gives me the ability to read analog data from up to 8 sources at once.
The sensors are enclosed in a plastic box with a fan to push air over the sensors.
DS18B20 Temperature
The DS18B20 temperature sensor was the first sensor I ever used and I still use it in new projects. These sensors are very precise, accurate, and versatile enough to include in many projects.
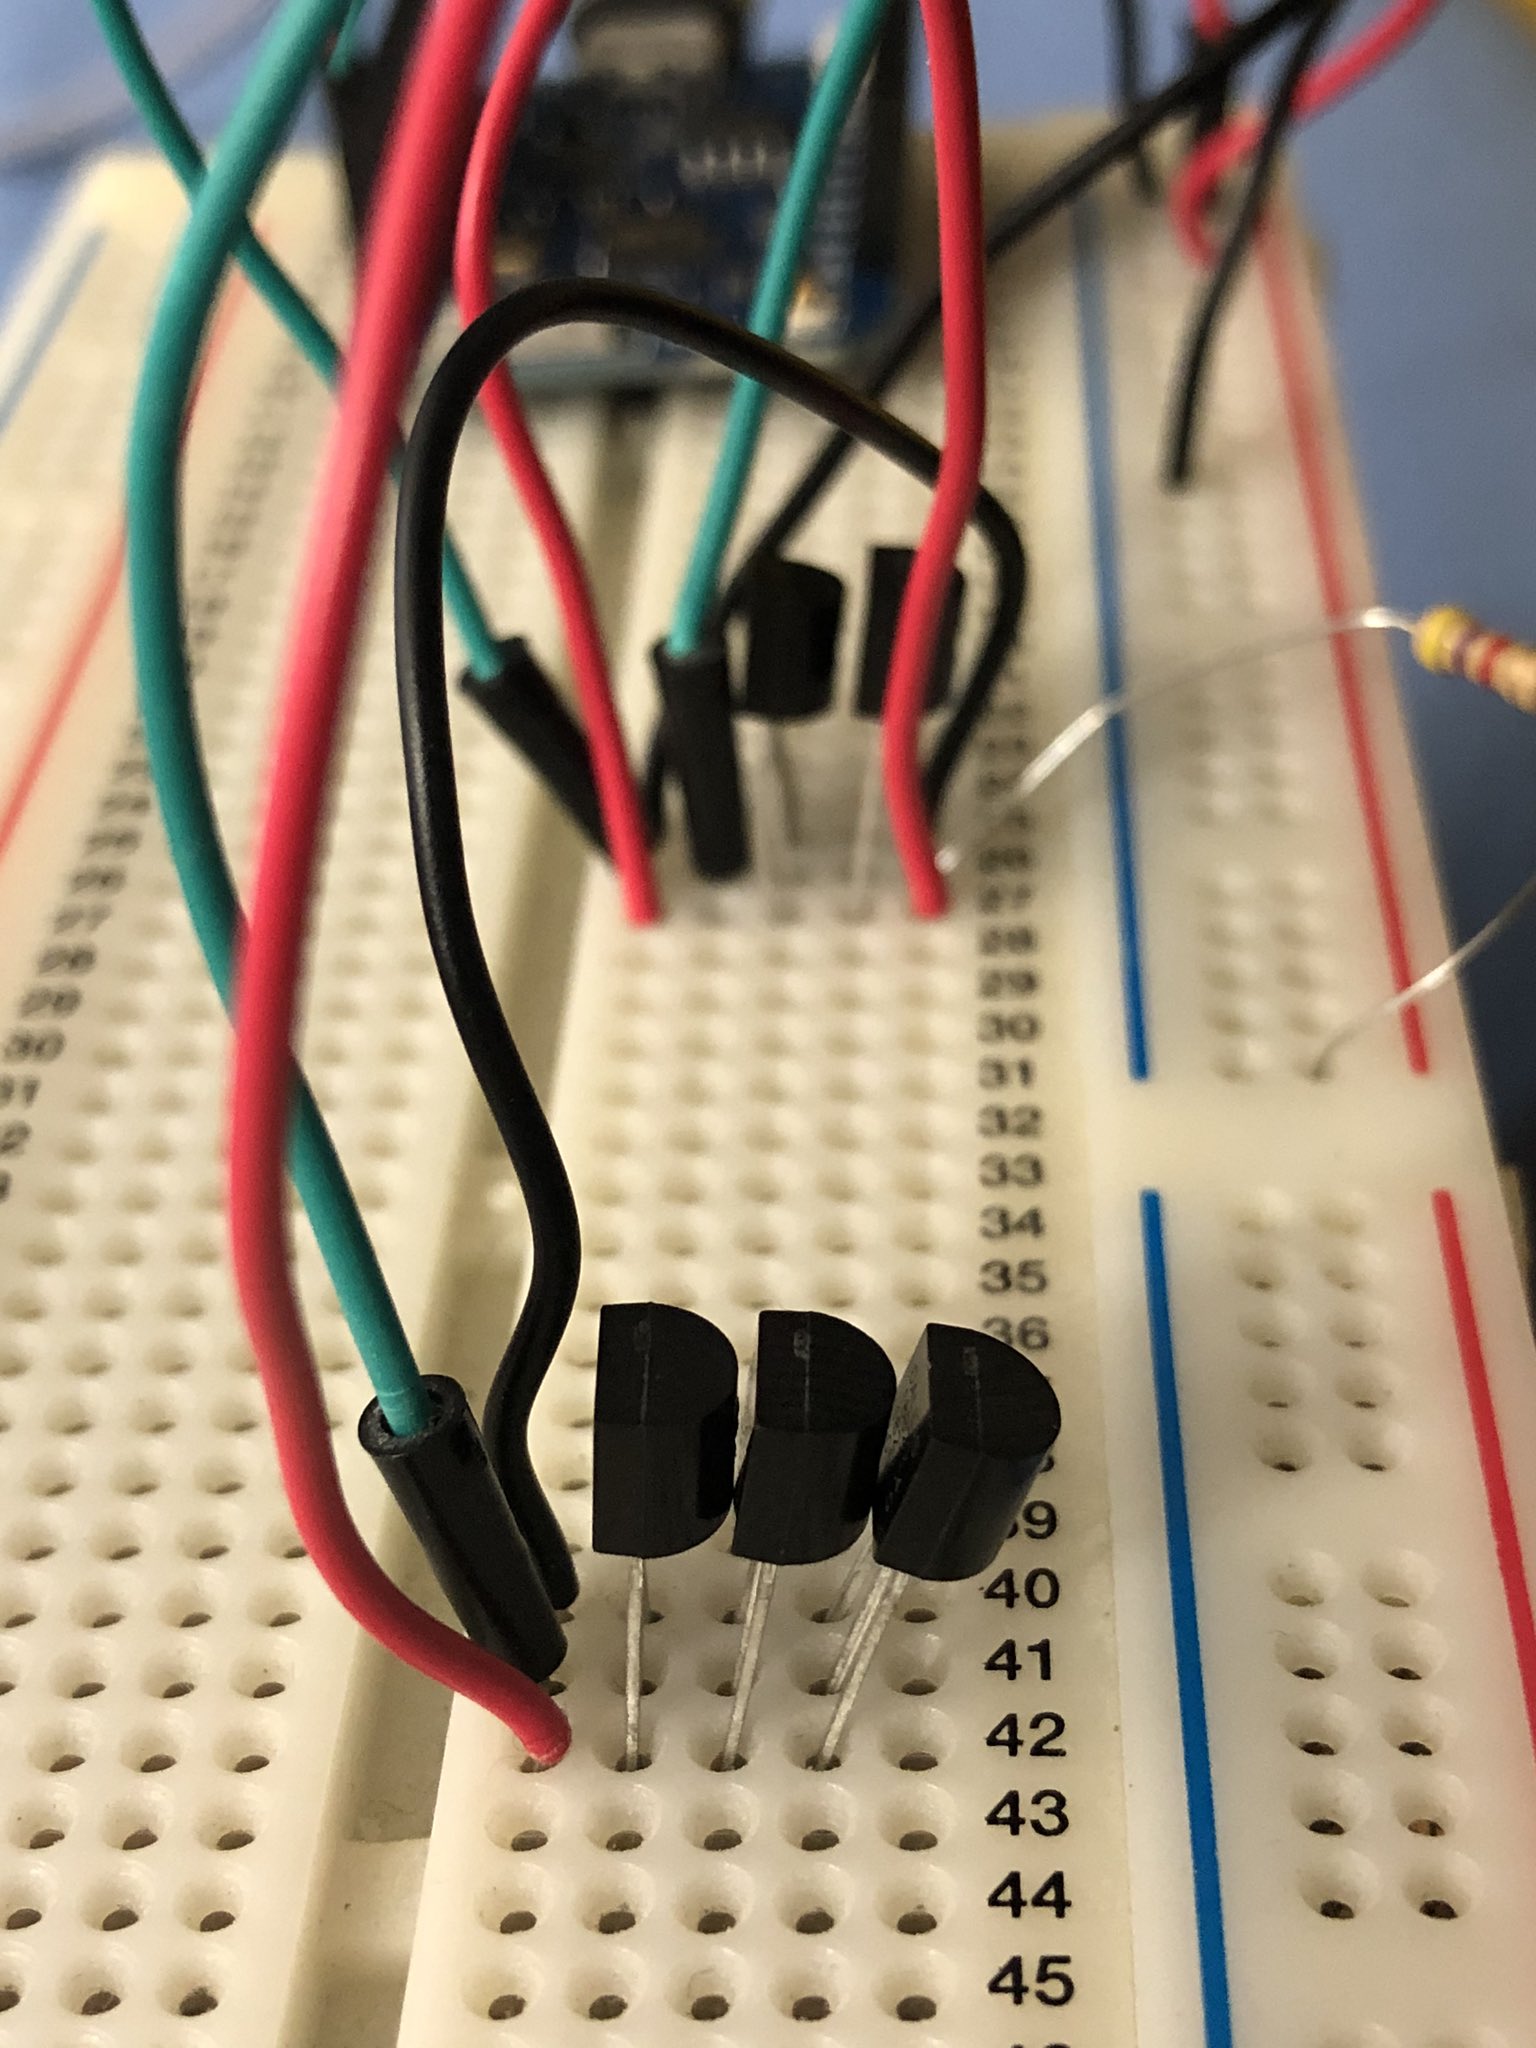
Below is an image of some of my DS18B20 sensors being tested. By testing multiple sensors on one board, you can identify any sensors which need an offset applying to their data.
This test may also identify fake sensors (commonly sold on ebay or aliexpress) because they often don't work well together on a bus or have conflicting IDs.
WS-07 Transmitters
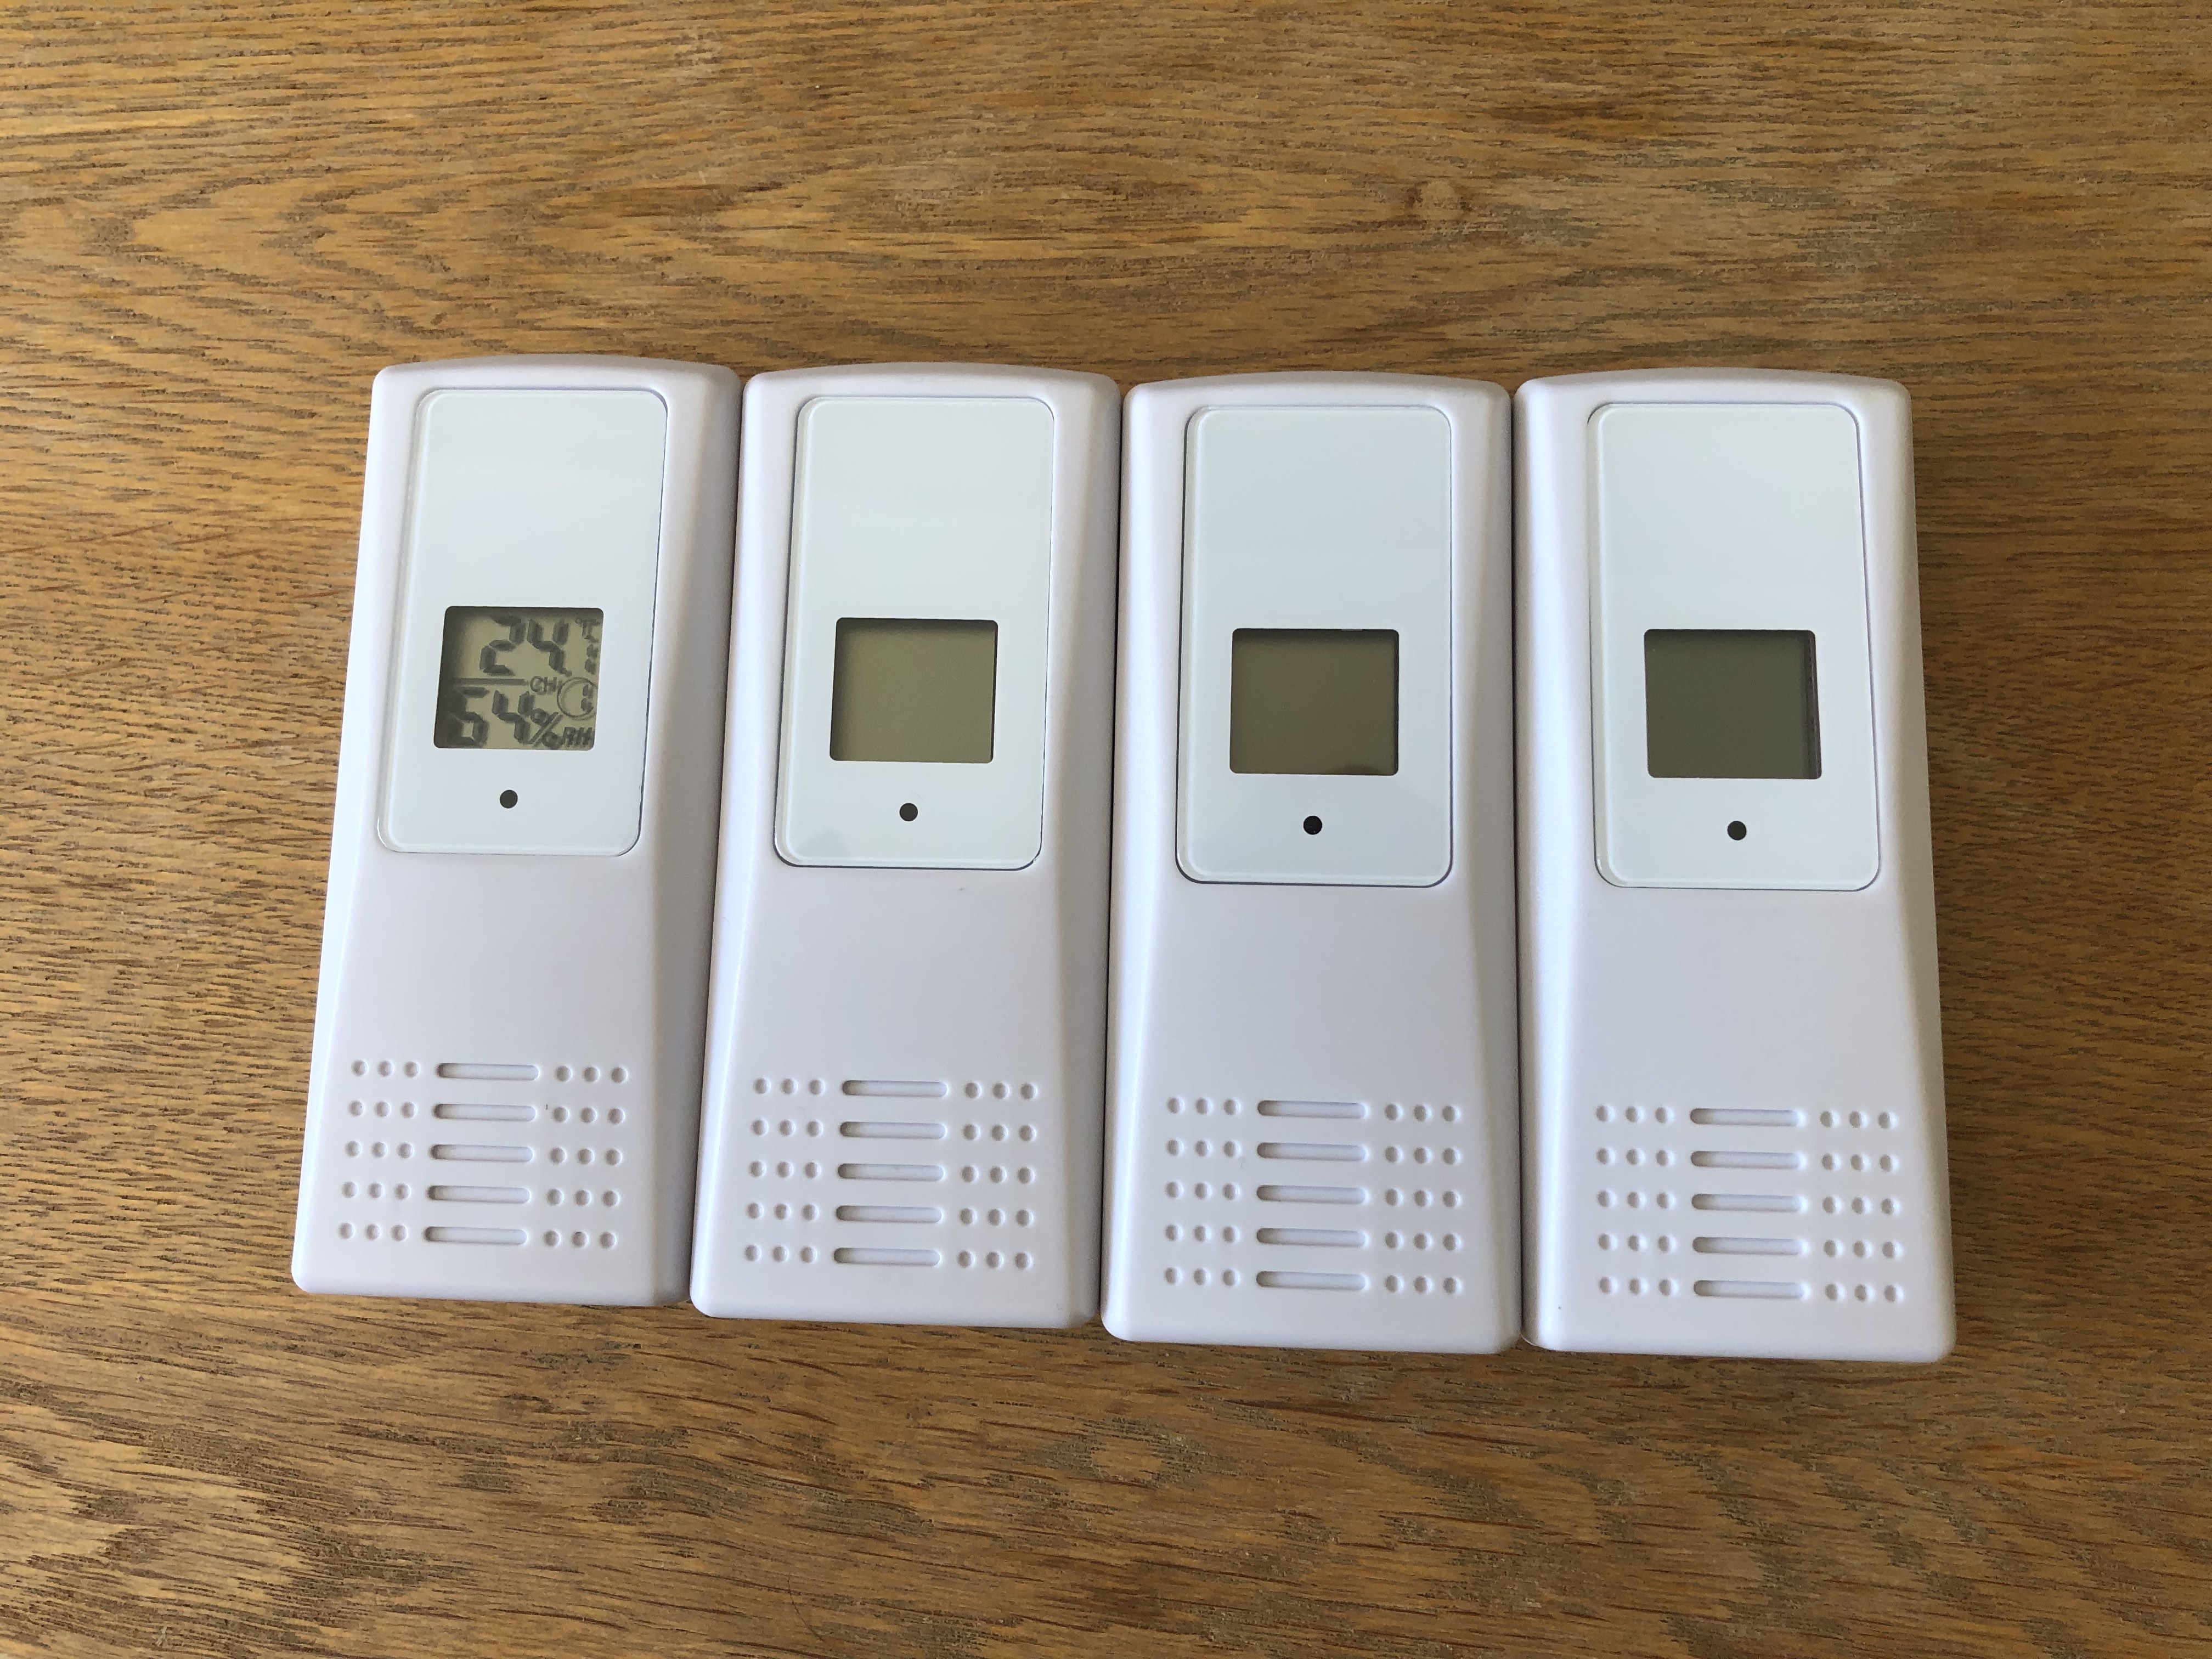
In order to monitor the temperature inside of our fridges and freezers, I bought some waterproof WS-07 temperature/humidity transmitters as shown below:
These transmit on 433MHz and can be decoded by rtl_433 and an SDR. I have configured rtl_433 to push all decoded messages to Node-Red which then looks out for my transmitters. The data from these transmitters is sent to IoTPlotter.
CurrentCost Power Monitor
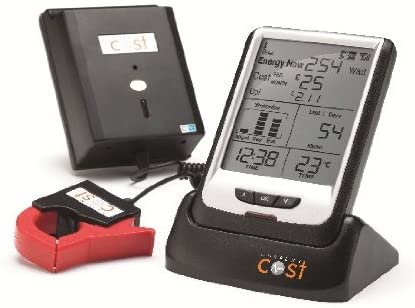
We have owned a CurrentCost power monitor for a long time (see image below).
I took this image from the Amazon product page.
This CurrentCost device includes a “clip-on” sensor which goes over a wire in the electricity meter cupboard and broadcasts the data over 433MHz to a display unit which you put elsewhere in your home. The display unit includes an RJ45 port on the back which can be used to export data as XML (using a special cable; not ethernet). For a short while, we used an Arduino Uno and Ethernet Shield to grab this data and forward it elsewhere.
Eventually, the base station unit failed so we had to grab the data “out of the air” instead. Thanks to lots of good work from the open source community, rtl_433 gained support for the CurrentCost and now the data can be decoded with an SDR.
See the Whole-House Power Monitoring page for more information about this setup.
Light Levels
I use an LDR (Light Dependent Resistor) in one room of the house to log the light level. This works well but there are now digital sensors which are much more accurate. I also used an LDR in my Makerspace Auto-Tweeter project.
List of Sensors being tested
I also have some sensors which I am testing; possibly to be included in projects later on.
- MAX30105: Experimental seismograph
Experimental seismograph
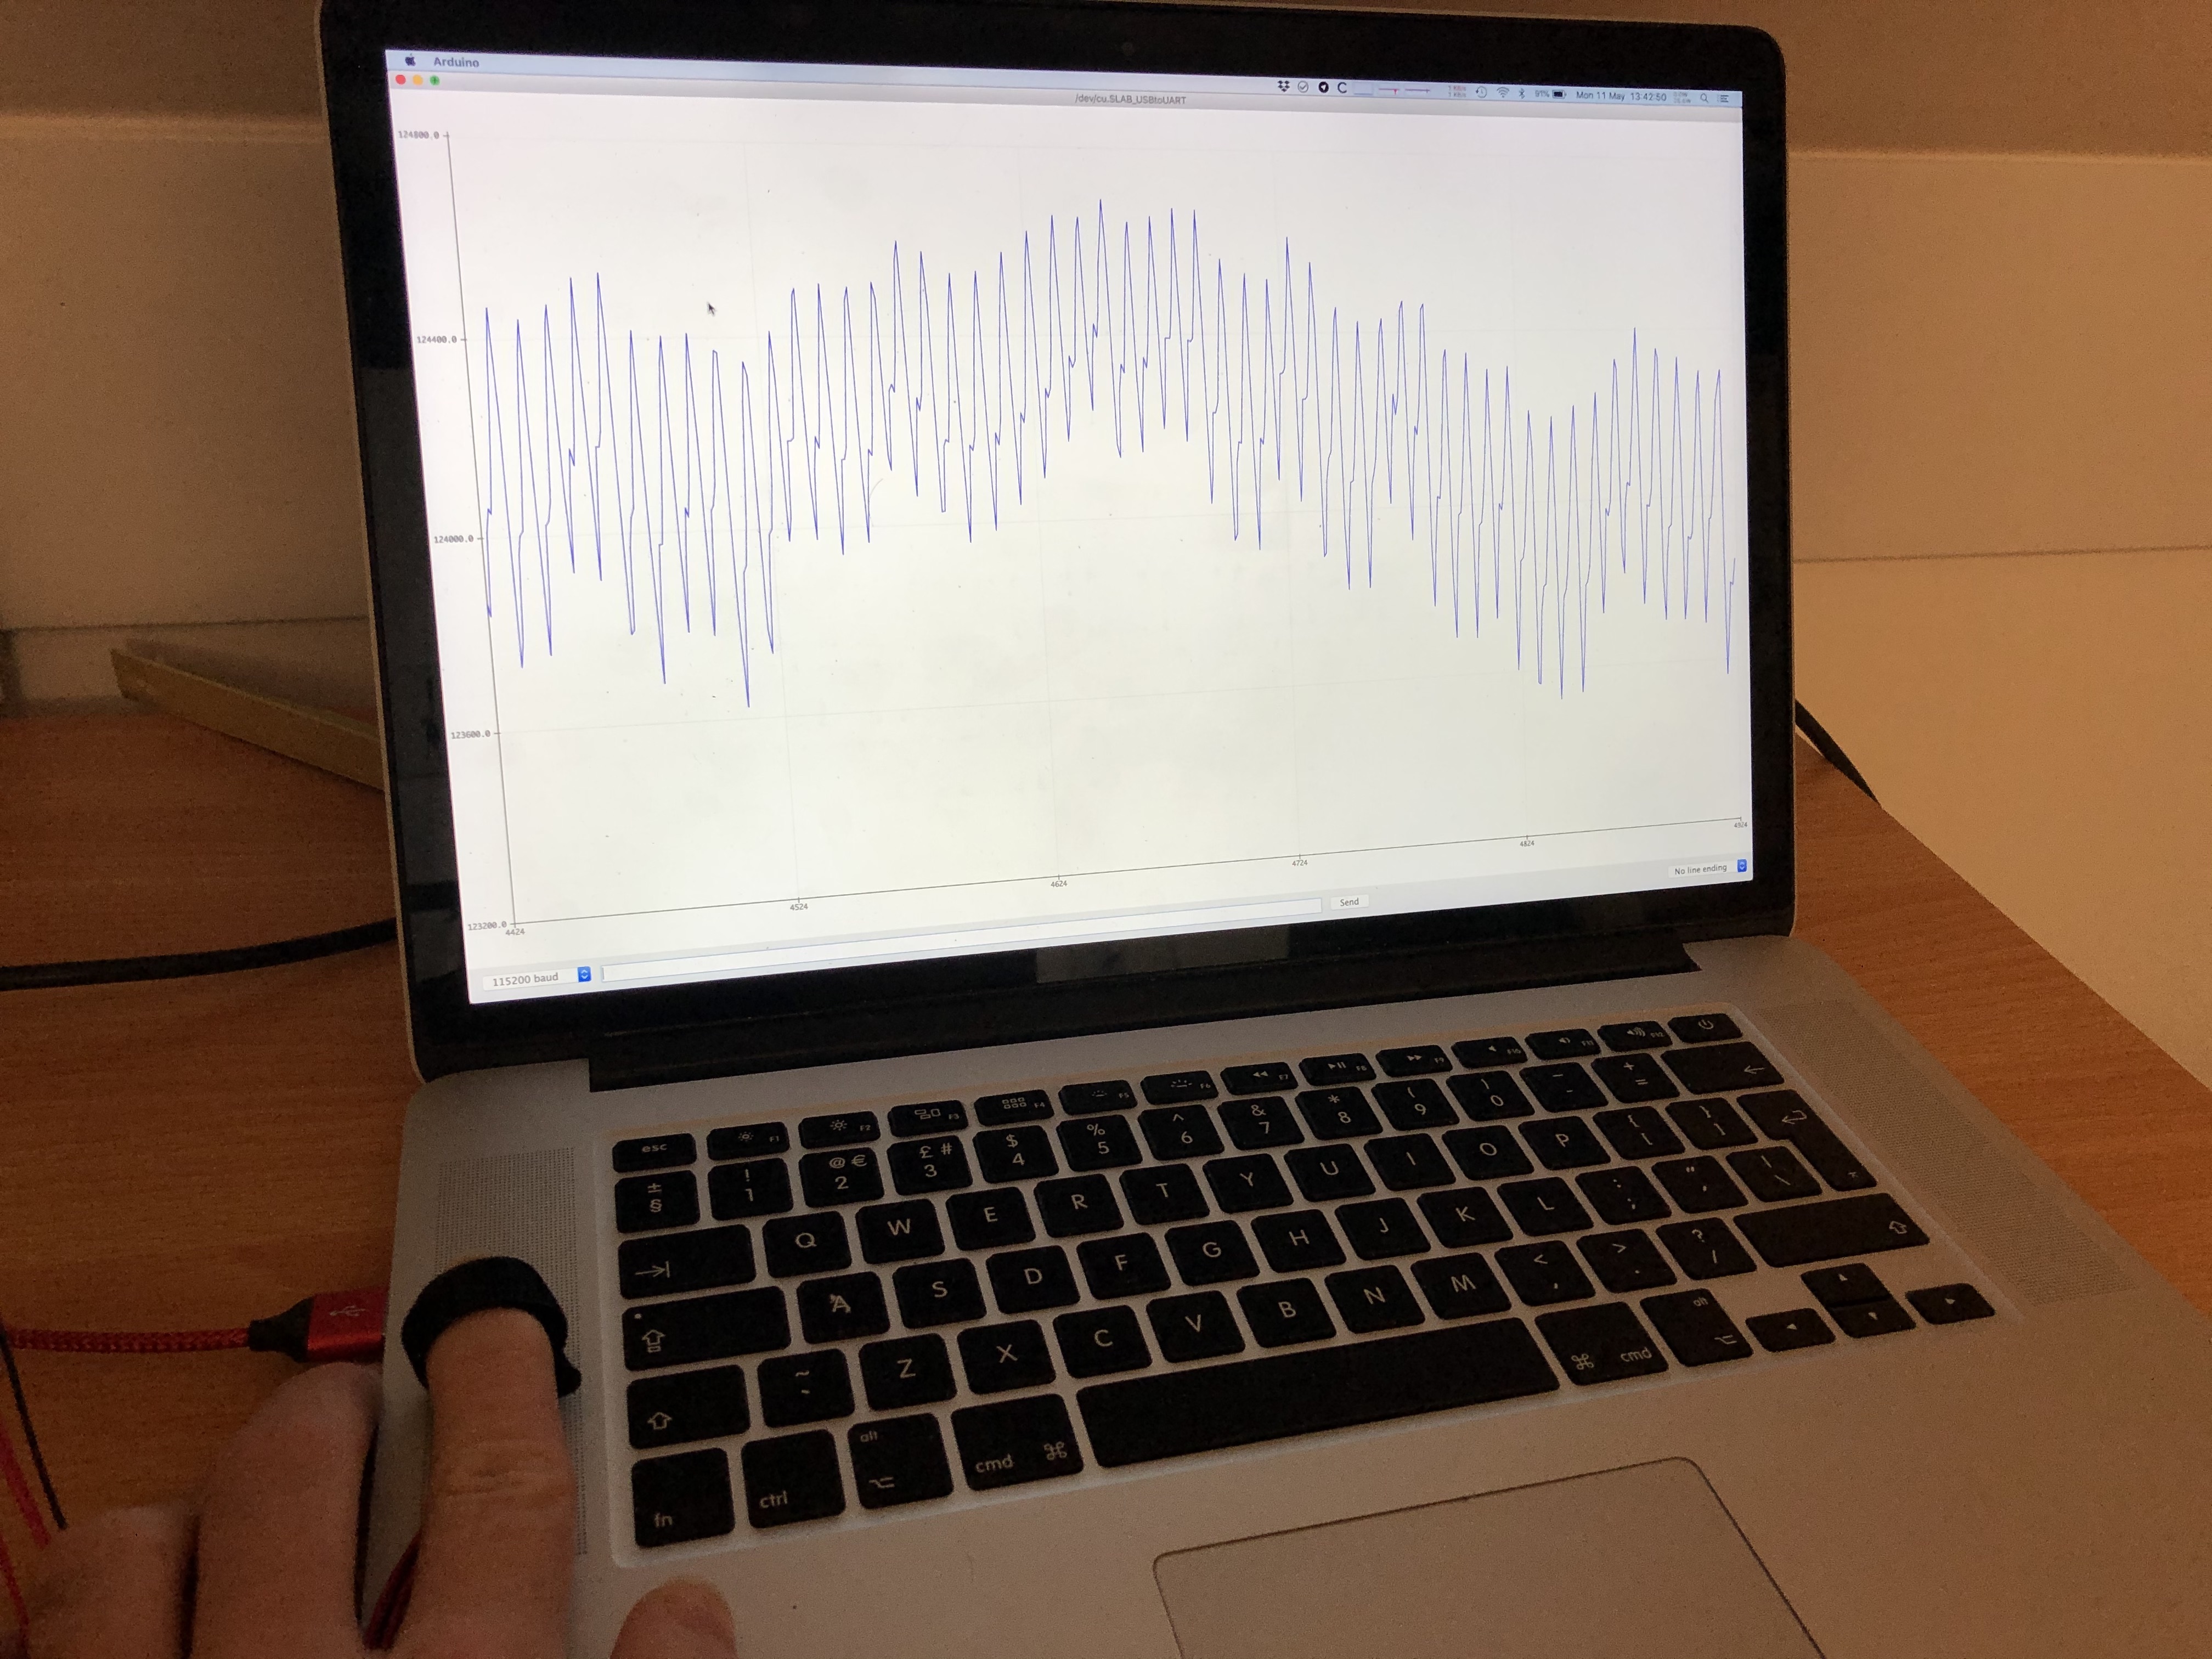
The MAX30105 operates by shining a light and measuring how much of that light is reflected back. This can be used to detect visible particles in the air (smoke / dust) in a similiar way to a PM2.5/PM10 sensor. This sensor is also commonly used to detect the heart rate of a person when held against their fingertip as shown below:
This sensor is so sensitive to changes that I was able to make a very basic seismograph. In order to achieve this, I suspended the sensor in the air by a wire and pointed it at a white sheet of paper. I then sealed the whole contraption into a black plastic box. Any vibrations which were picked up affected the distance between the paper and the sensor causing a change in the data.
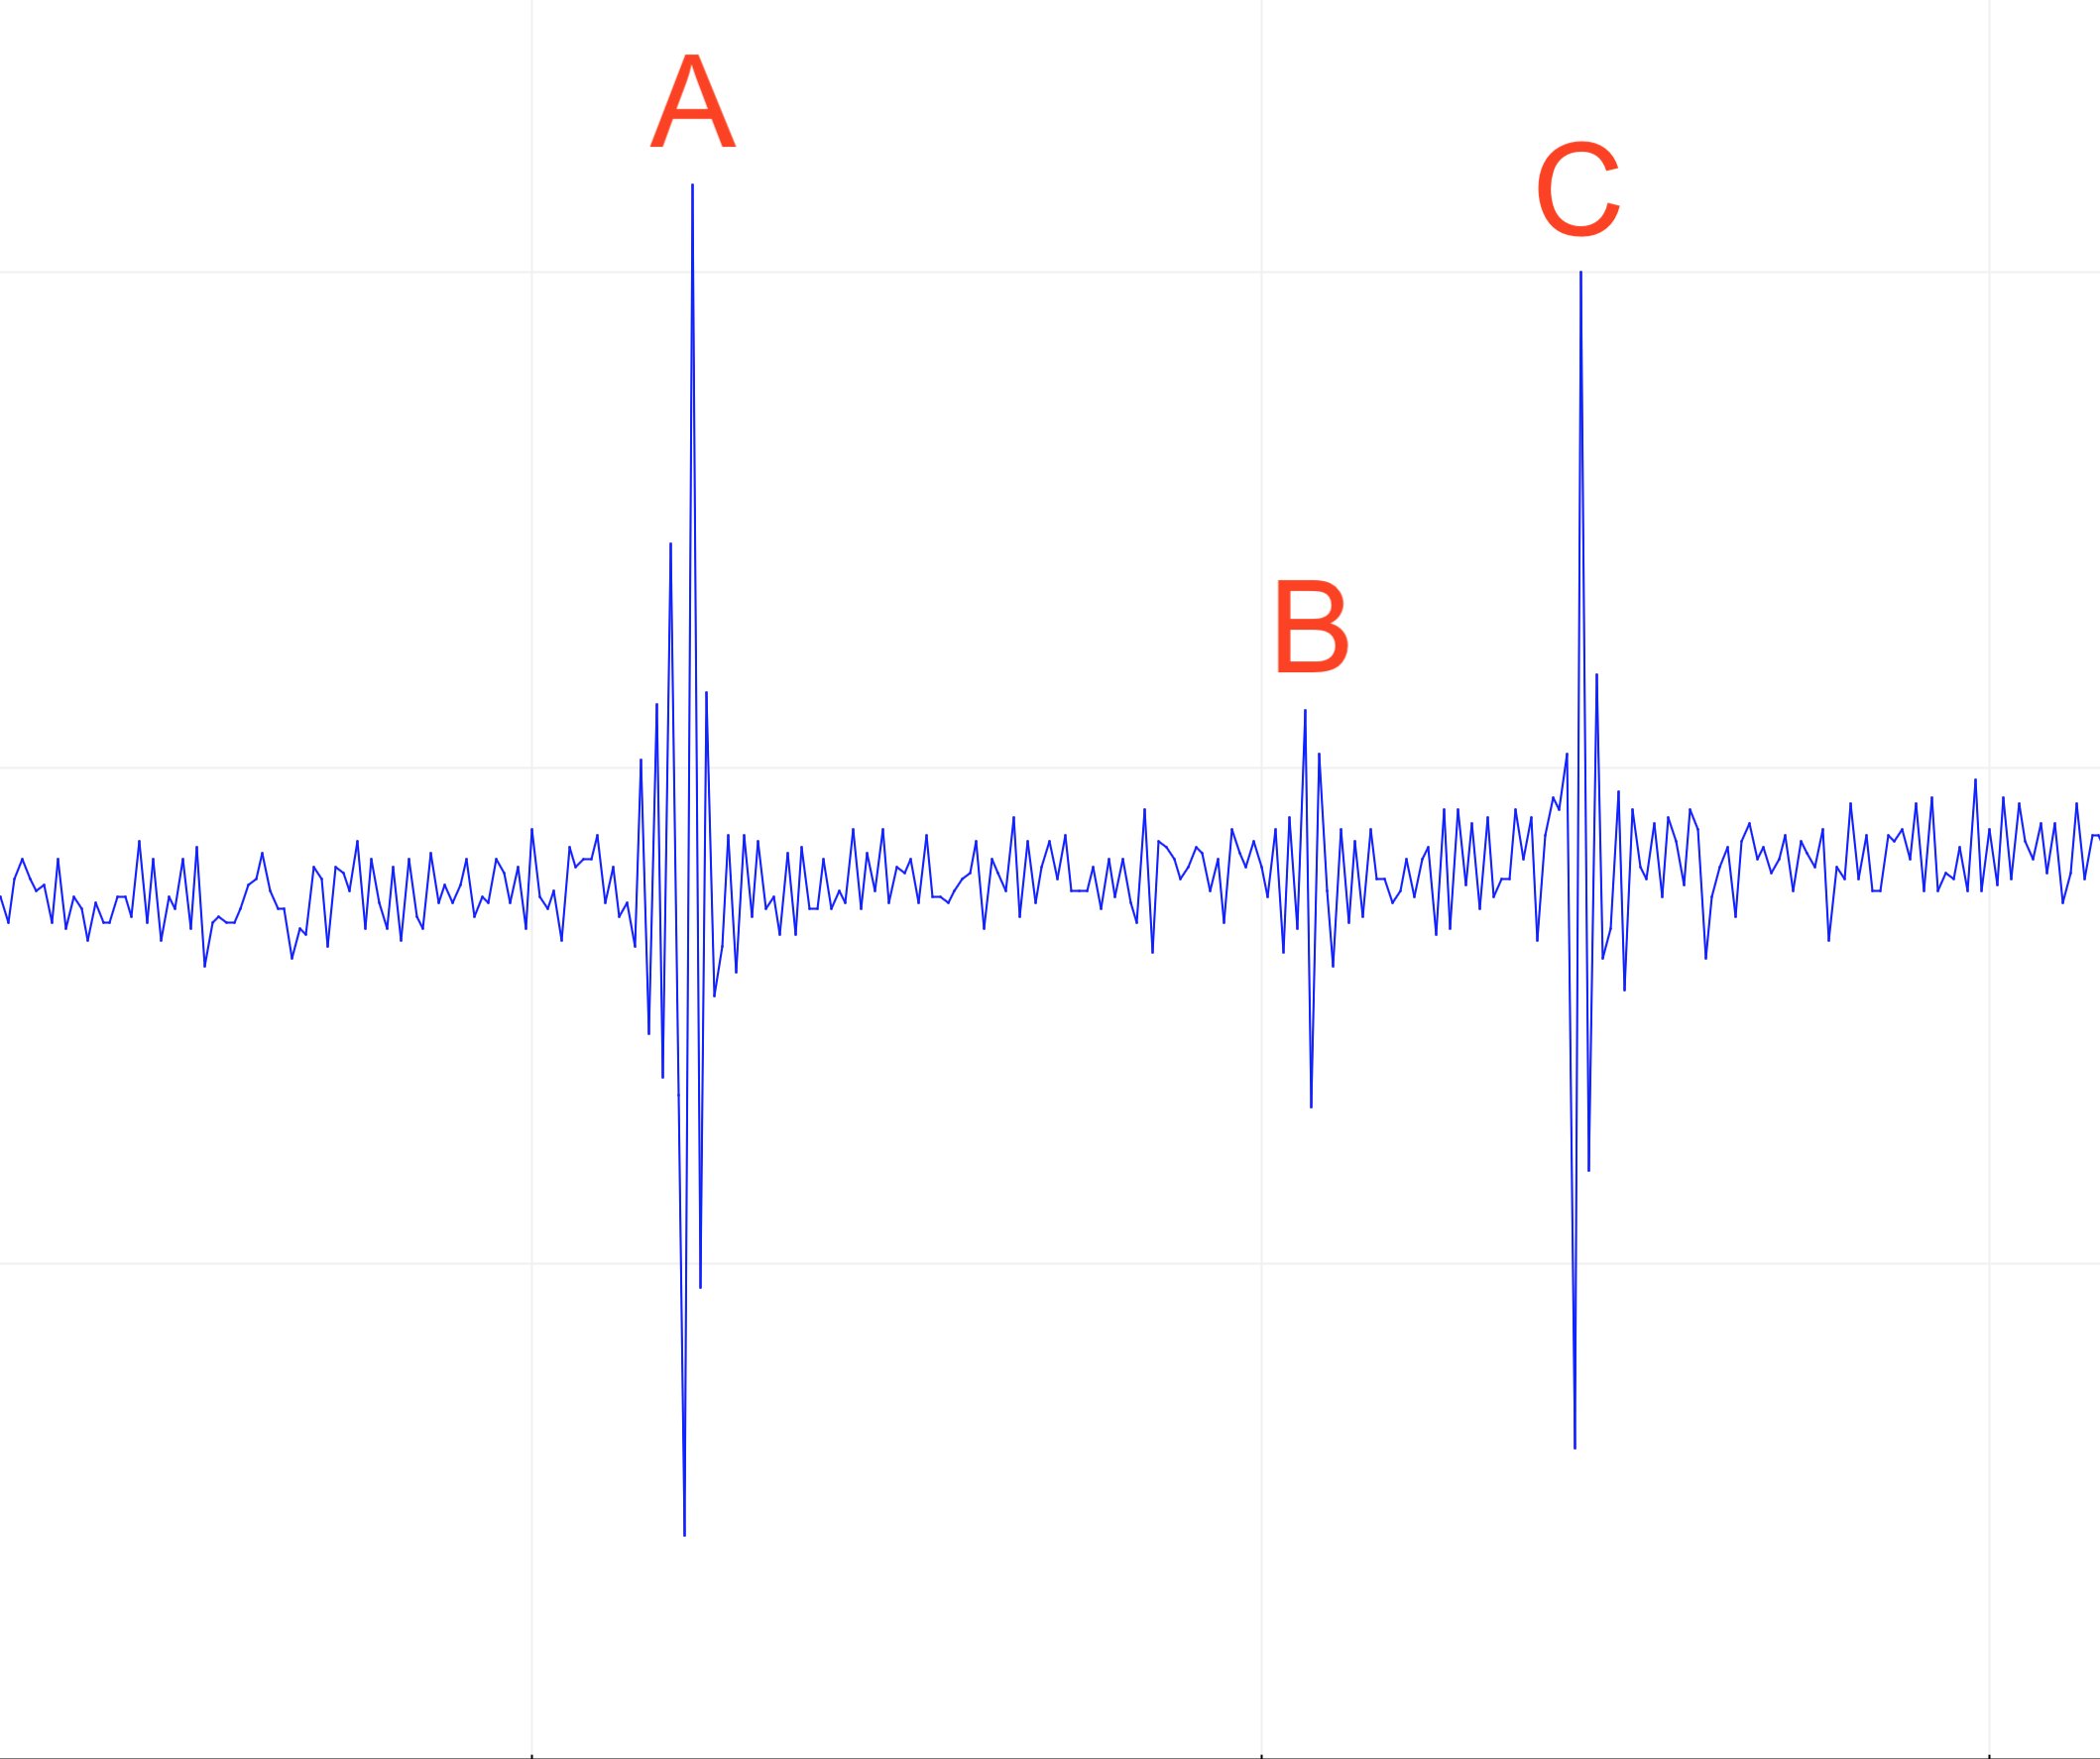
Take a look at this data which I generated using this sensor:
A: Single tap of my foot on the floor. B: Single hand clap in the air. C: Another single foot tap on the floor.
At times, the sensor was also influenced by car doors slamming closed outside the house. Unfortunately, I later discovered that my desk was playing an important role in the whole setup. Specifically, when the device was on my desk, even the tiniest of movements were detected but almost nothing was detected when it was placed on solid ground.
In addition, gravity was slowly pulling the sensor towards the paper and eventually it would probably get too close to function correctly. Using a spring instead may solve that problem. I highly doubt this sensor could be used as a reliable seismograph but I have proven it definitely has some potential to be used as one.
Water Flow
I recently bought a generic water flow meter. These sensors work on a basic principal and consist of a hall effect sensor with a magnet connected to an impeller suspended within the path of the water. The water causes the impeller to rotate, and the hall effect sensor triggers an output pulse for each rotation.
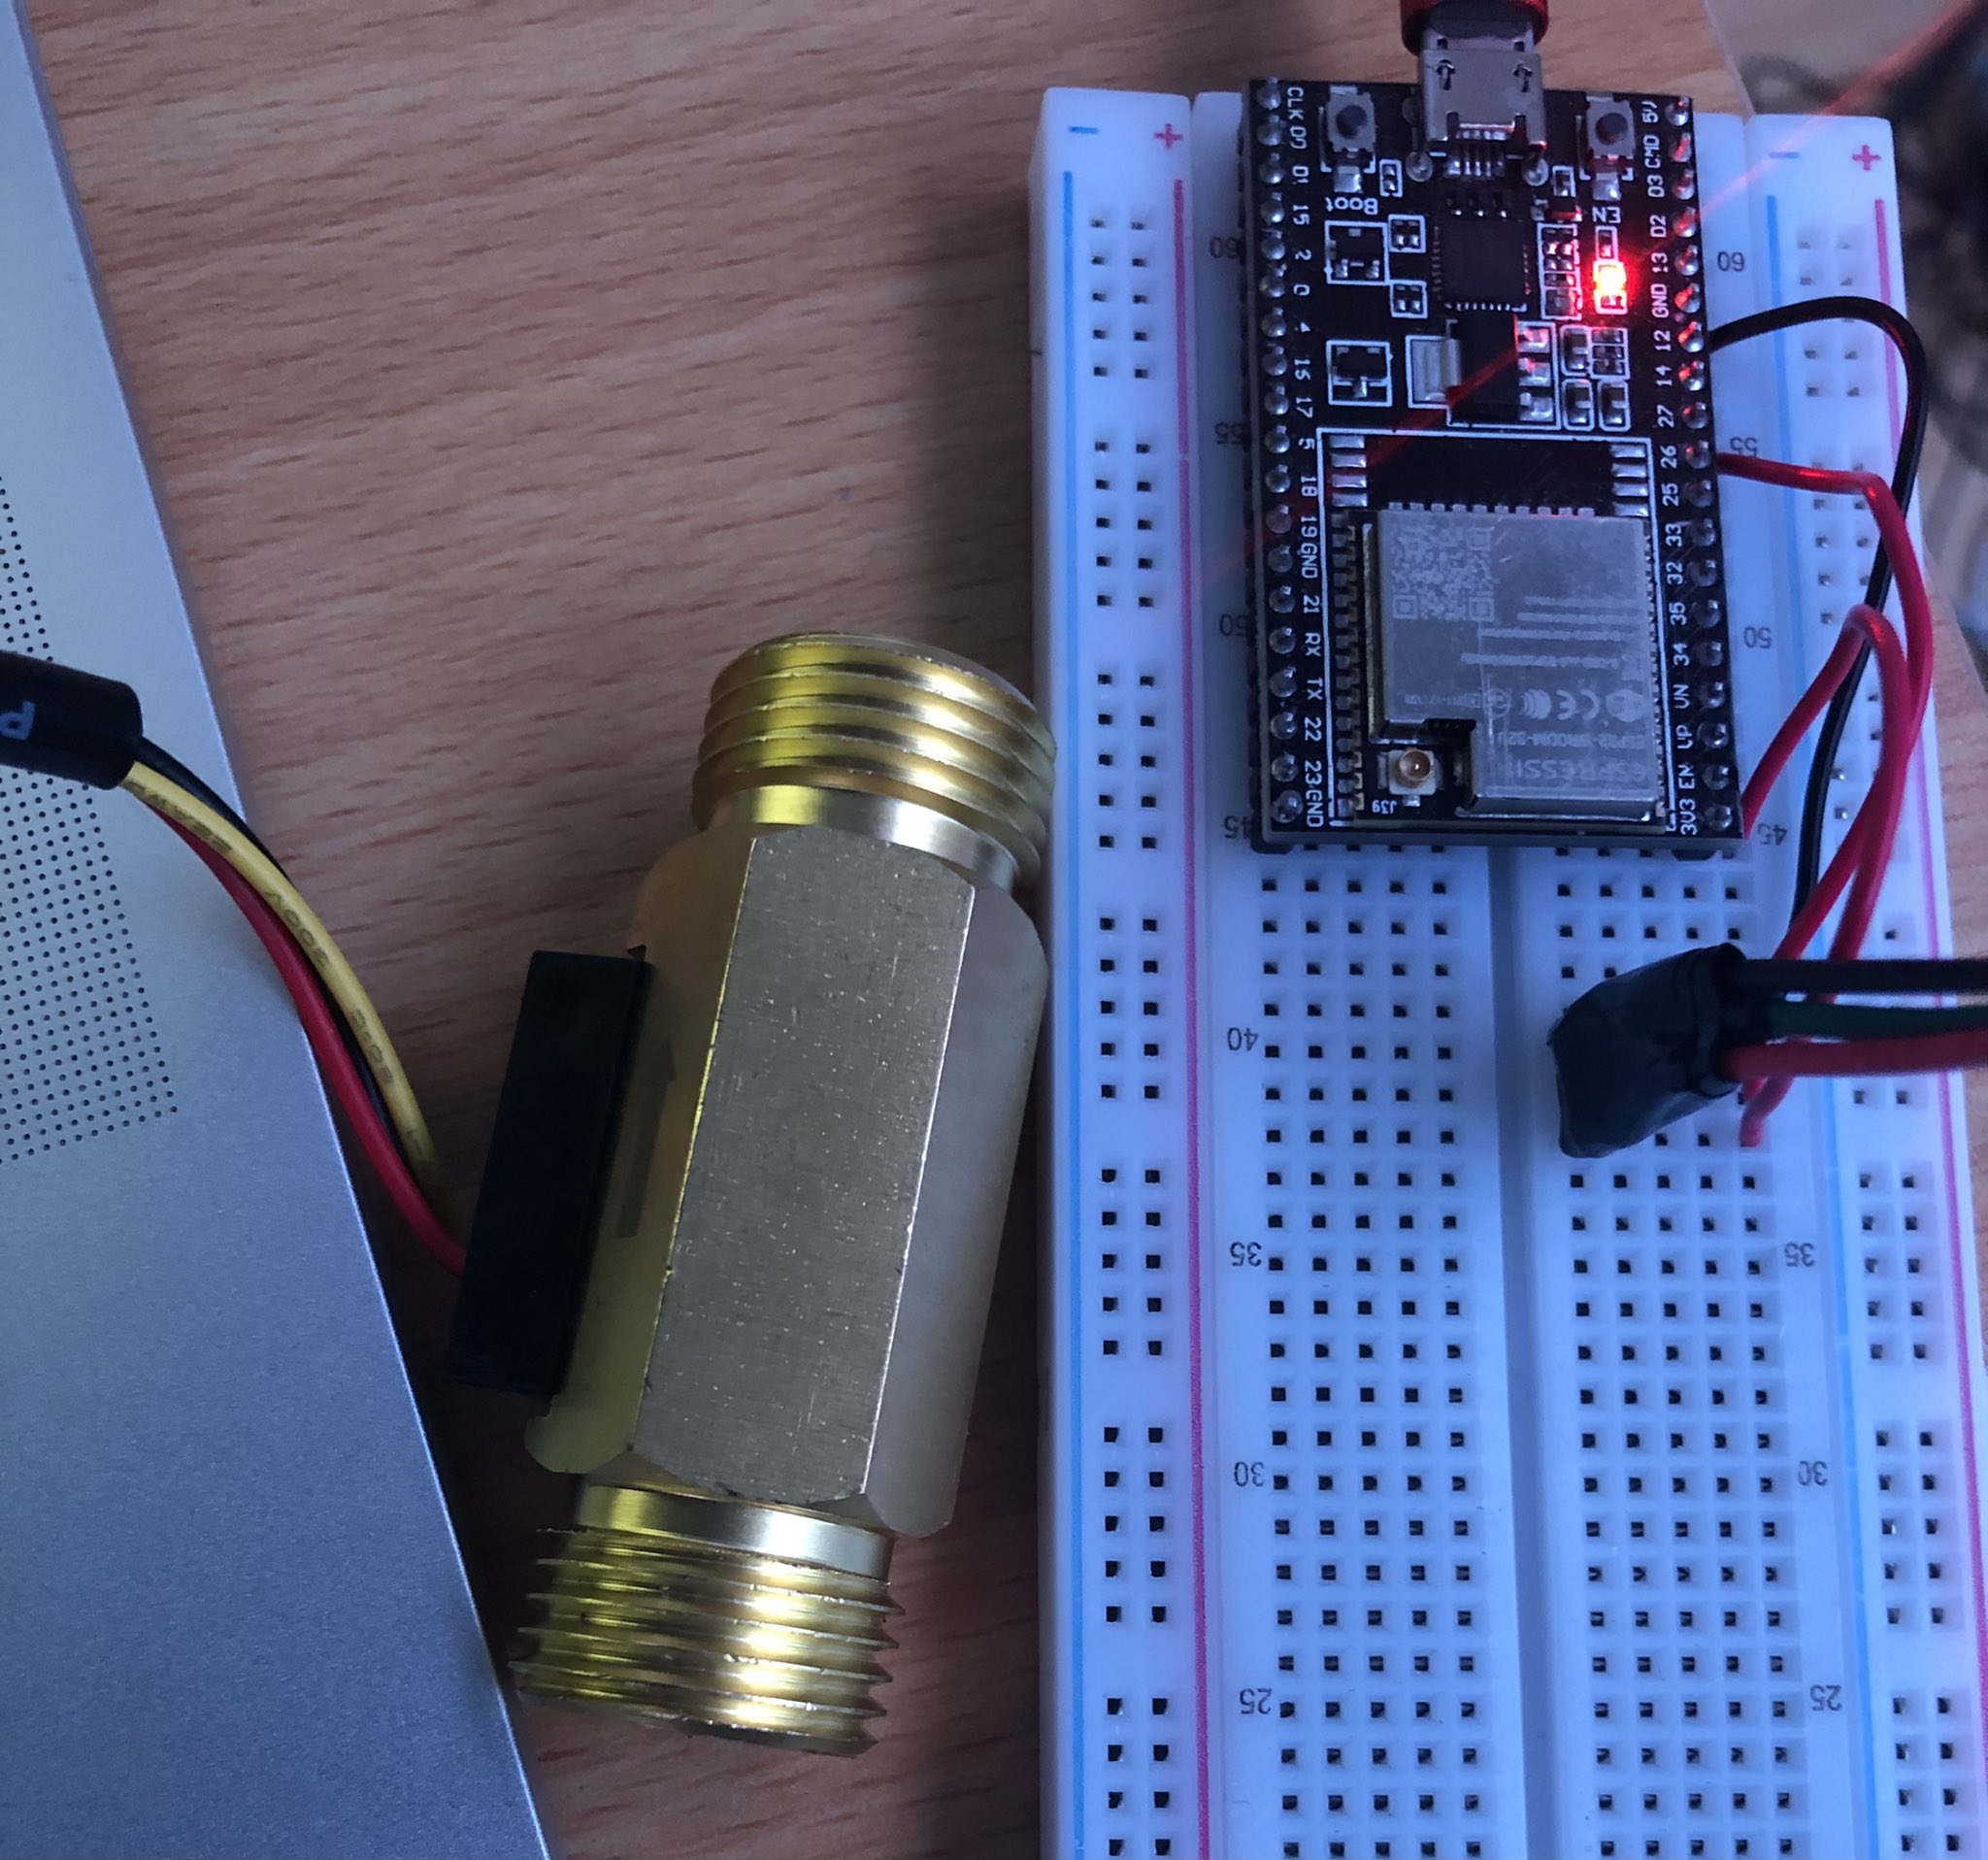
I have done some quick and basic tests with this flow meter (image above shows the meter and an ESP32 for testing it with). Here are the results from my test:
| Millilitres of Water | Digital Pulses Received | Pulses per Litre |
|---|---|---|
| 1000 | 586 | 586 |
| 500 | 307 | 614 |
| 300 | 176 | 587 |
The 1000ml and 300ml tests gave 586 pulses per litre and 587 pulses per litre respectively which correlate strongly. The 500ml test gave 614 pulses per litre which is an outlier. The datasheet states that one litre will generate 596 pulses (with a +/-10% margin) which agrees with my data.
By using 587 pulses per litre in the calculations, we know that ~1.704 millilitres of water will generate 1 pulse and this can be used to convert a pulse count into an amount of water. For example, the 500ml test produced 307 pulses which indicates 523ml of water; this is possible since I was only doing a quick test to check the consistency and overall functionality of the meter.
I will do some more accurate tests before using this meter but at least I now know the datasheet is probably accurate.
Battery Powered Transmitters
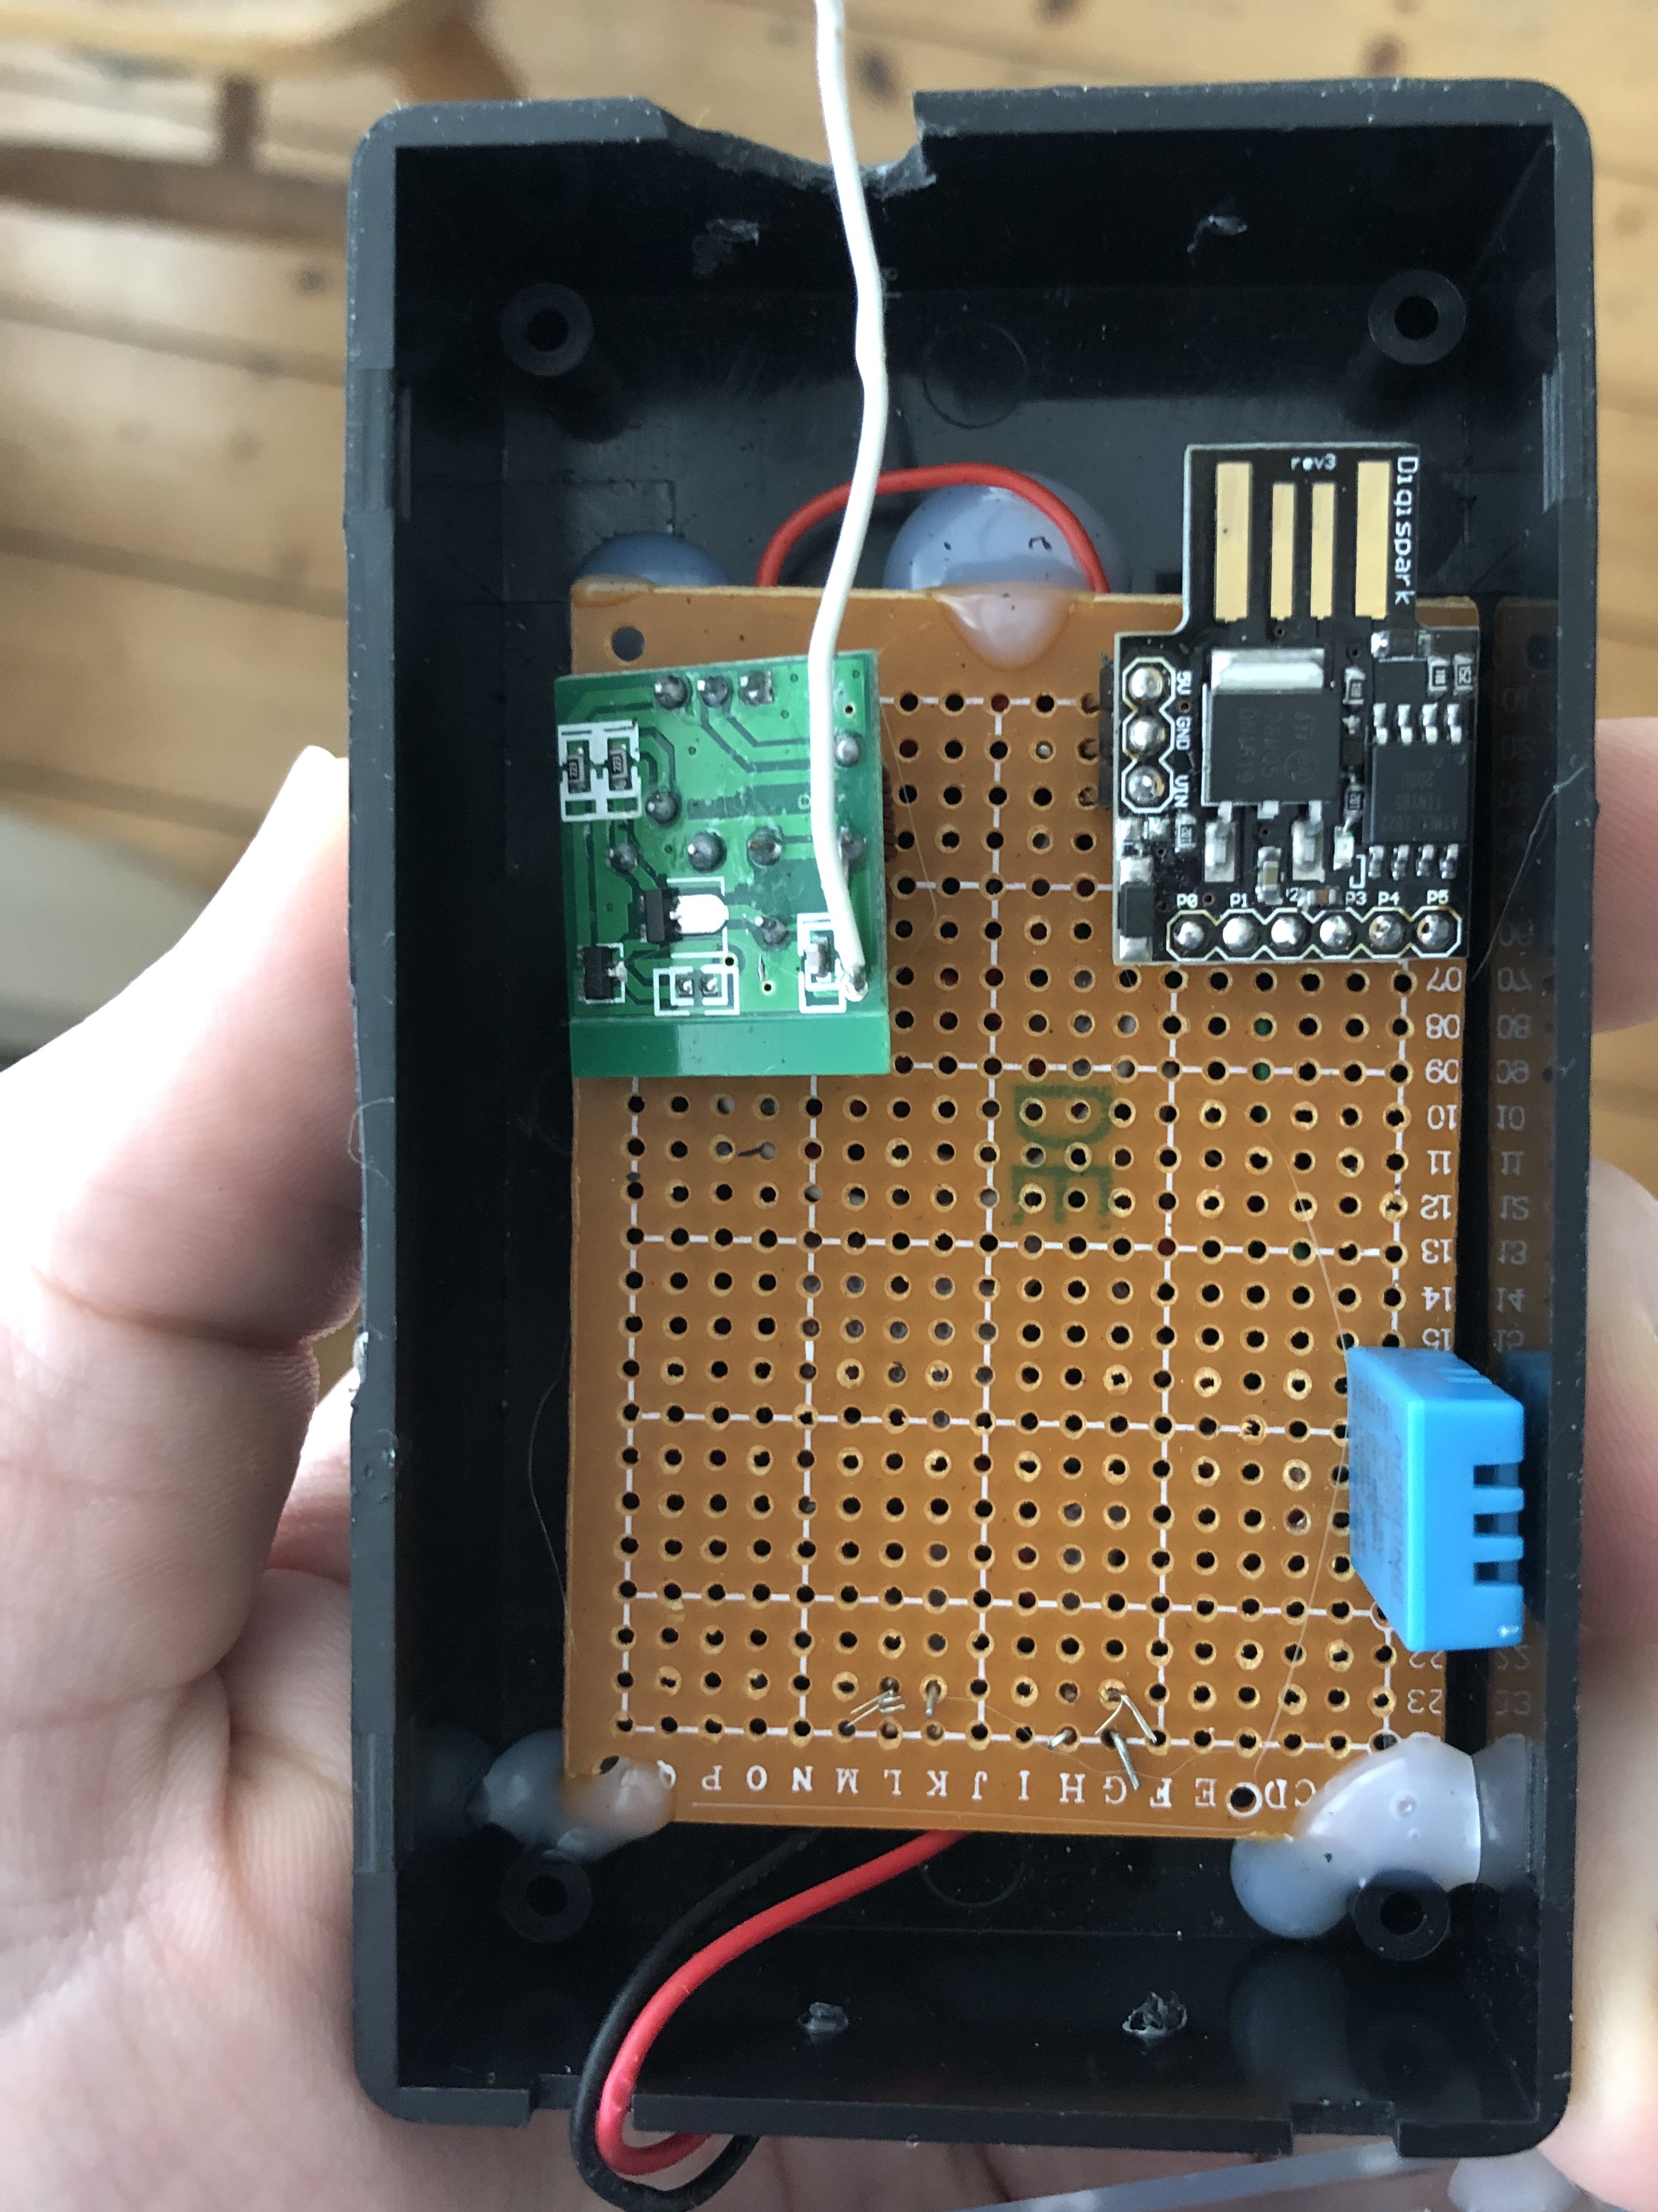
For a short period of time a few years ago, I was interested in making portable battery powered sensors. I created 3 transmitters which used a Digispark microcontroller, a DHT11 temperature and humidity sensor, a 433MHz transmitter, and 4x AA rechargable batteries.
The battery life of this device was around 5 weeks due to a design flaw; the DHT11 sensor was connected directly to power and would never get shut down meaning it was constantly drawing power.
All of the sensors around the house are in fixed positions in order to maintain consistency. I decided that the portable sensors weren't particularly useful because all of the fixed-position sensors had access to power cables. When I finally found a use case for battery powered transmitters (fridge & freezer monitoring), I decided to use WS-07 transmitters because those are waterproof and much smaller than anything I can make. I saw no reason to “re-invent the wheel” in this situation.
My transmitters featured very accurate battery voltage monitoring so I could get timely notifications when I needed to replace and charge the batteries. The range was very good when using an SDR with a filter and amplifier as the receiver.
